Tim Marshall, PE - A Legend in Weather, Meteorology and Engineering
In the dynamic world of weather, meteorology, and engineering, one name stands out as a true legend—Tim Marshall. With a career spanning over four decades, Tim has become a powerhouse in the field, earning a reputation for his exceptional expertise in roofing systems, building envelope systems, wind/hail damage evaluations, storm surveys, and much more. Currently serving as a Principal Engineer at Haag, Tim’s dedication and passion have made a lasting impact on the industry.
Tim’s journey began with a childhood fascination for studying building damage, paving the way for a remarkable career in engineering and consulting. His primary areas of focus include everything from hurricane and tornado evaluations to construction defect assessments and meteorological investigations. As a testament to his influence, Tim is currently the subchairman on the ASCE Wind Speed Estimation on Tornadoes Committee – the EF Scale, contributing to the industry’s standards in assessing tornado damage.
One of Tim’s standout qualities is his innovative approach to problem-solving. When faced with challenging projects, like the LTV Tower project in 1984, where he had to confront his fear of heights, Tim’s ingenuity came to the fore. Working on a scaffold clamped to a parapet wall several hundred feet above the ground, he and his team devised a solution using wedge anchors to secure the brick veneer to the concrete wall—a testament to his problem-solving prowess.
Remaining at the forefront of industry trends is crucial, and Tim accomplishes this through active participation in professional organizations and volunteering. His hands-on involvement in the industry is instrumental in shaping standards for assessing tornado damage, directly impacting his work at Haag.
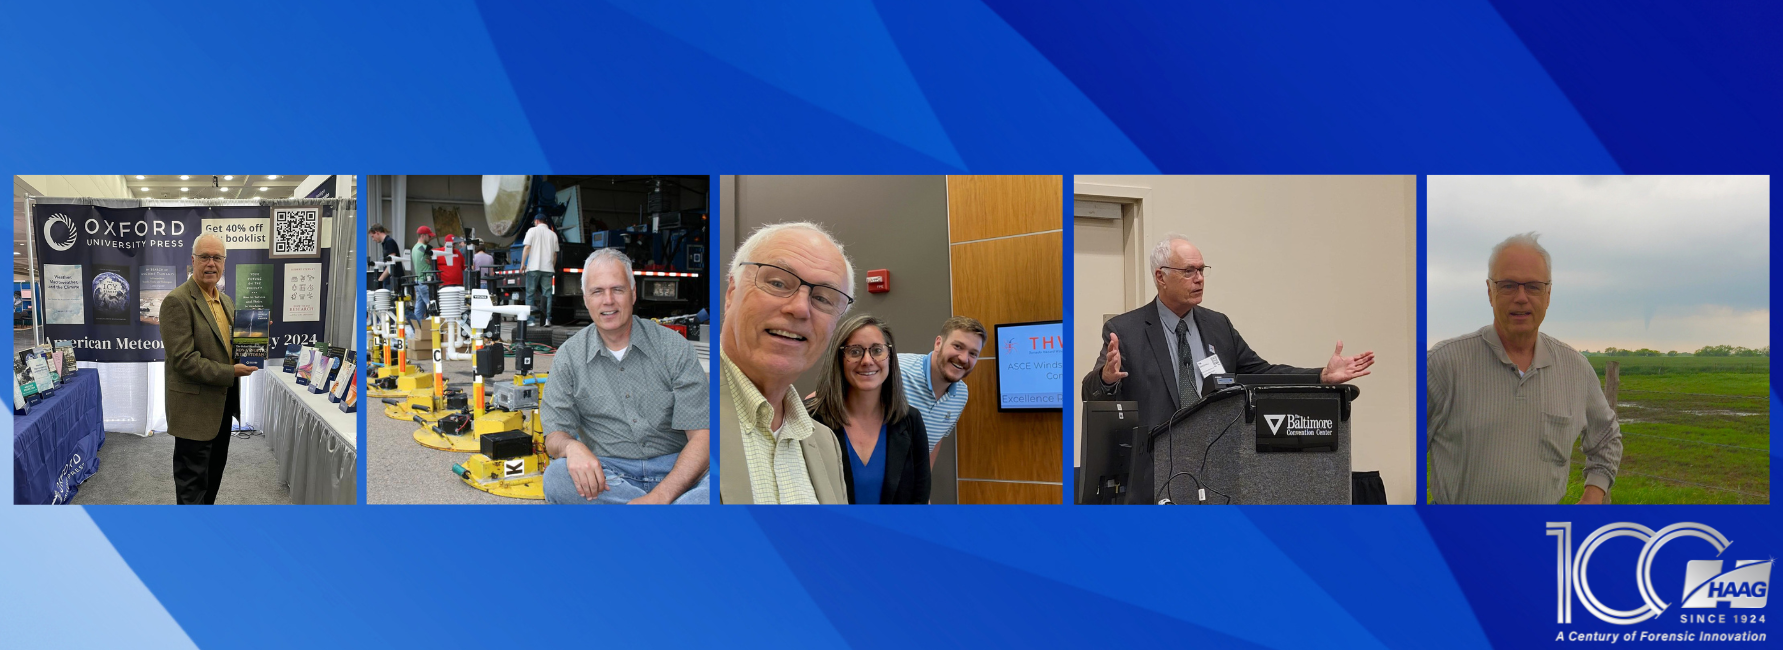
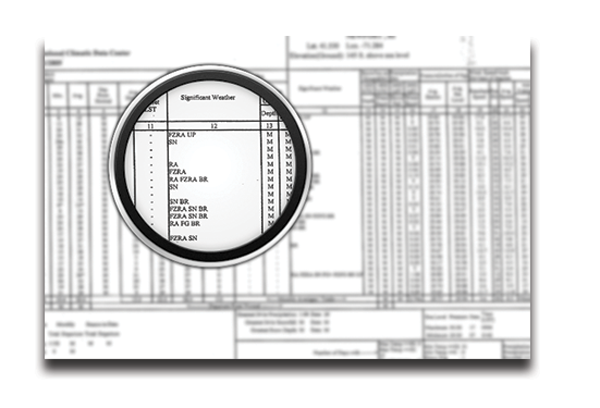
Tim’s commitment to advancing meteorological understanding is evident in his recent participation at the American Meteorological Society (AMS) Annual Conference in Baltimore, MD. There, he presented groundbreaking findings on updating the Enhanced Fujita Scale to more accurately rate degrees of tornado damage. Additionally, his expertise extends to the realm of academia, as he contributed a chapter to a book published by Oxford University Press, focusing on the meticulous assessment of wind damage to residences. A member of the AMS for an impressive 50 years, Tim’s active engagement in such prestigious conferences and academic pursuits underscores his dedication to the continual enhancement of meteorological knowledge and its practical applications.
Throughout his illustrious career, Tim takes pride in accomplishments that extend beyond personal victories. After his 40+ year career, his most valued achievement is bringing in other engineers to Haag, such as Richard Herzog, Carlos Lopez, Christine Alfano, and Zach Wienhoff. Tim’s leadership and mentorship have created a legacy, with kudos extended to his mentors John Stewart, Stoney Kirkpatrick, and Dick Madison—the original three who hired him.
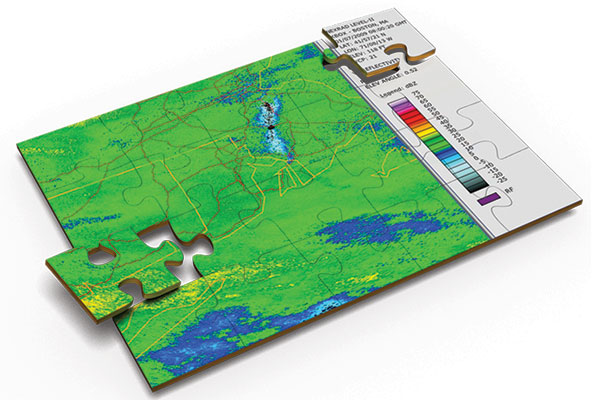
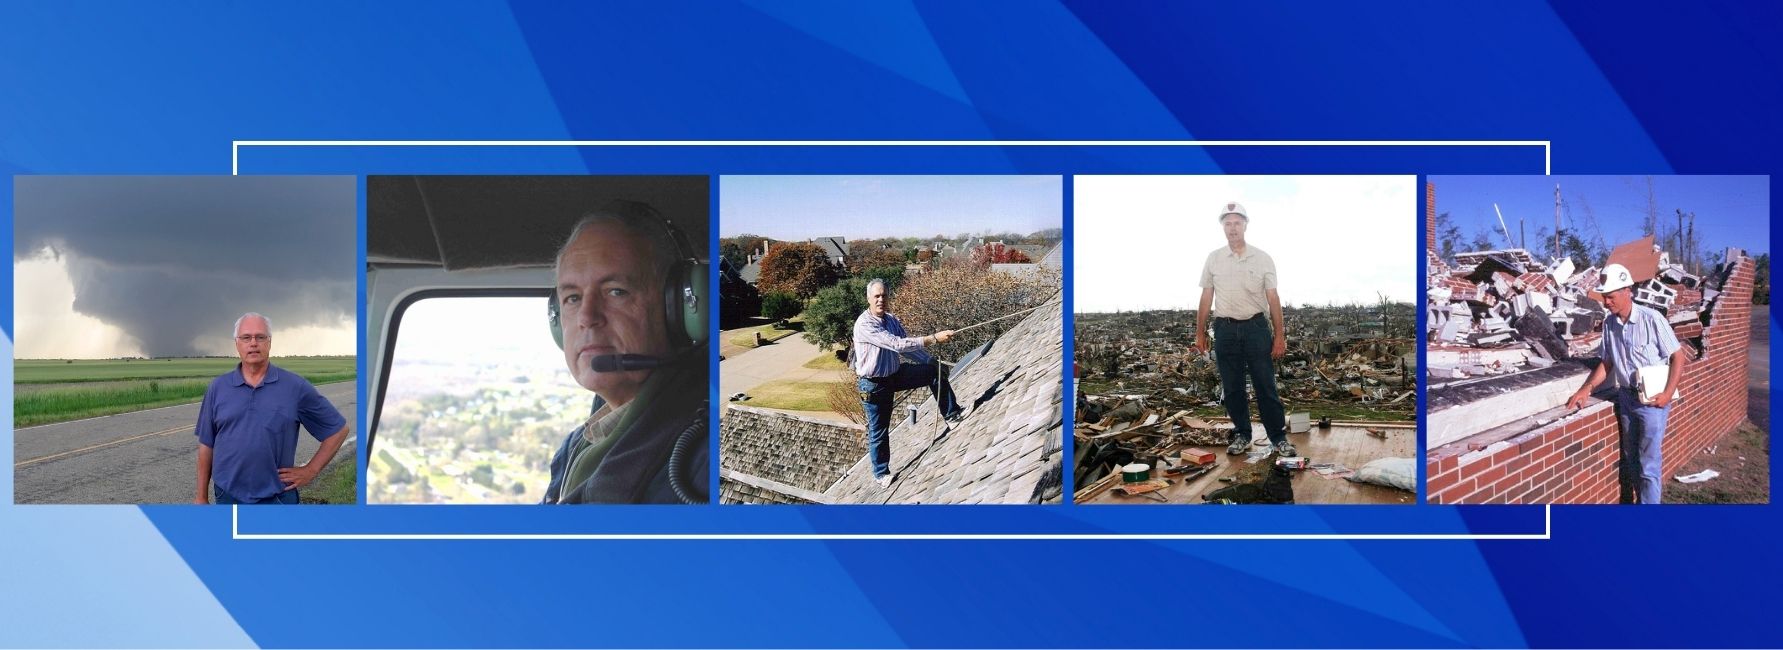
Outside the world of engineering and consulting, Tim finds rejuvenation in storm chasing, volunteering in government-sponsored projects like VORTEX, TWIRL, and ROTATE, and serving on the National Weather Service Quick Response Team. Tim has published more than 100 articles on storms and assessing storm damage and has appeared on dozens of television programs including Discovery, Learning, History Channel, NOVA, and The Oprah Winfrey Show.
In the ever-evolving field of weather and engineering, Tim Marshall continues to be an inspiration—a visionary who seamlessly integrates expertise, innovation, and leadership, leaving an indelible mark on the industry. We are privileged to have Tim as an invaluable asset to our team for 40 years and as a driving force in advancing the frontiers of weather-related engineering solutions.