Haag’s Hurricane Geoportal– Keep An Eye on the Data for the Eye of the Storm
The 2020 Atlantic hurricane season was the most active and the seventh costliest Atlantic hurricane season on record, causing just under $47 billion in damage. According to the National Oceanic and Atmospheric Administration (NOAA), “...the 2020 season produced 30 named storms (top winds of 74 mph or greater), including six major hurricanes (top winds of 111 mph or greater). This is the most storms on record, surpassing the 28 from 2005, and the second-highest number of hurricanes on record.” This historic hurricane season also saw record water levels in several locations, including the Gulf Coast where Hurricane Sally brought the highest observed water levels since Hurricane Katrina. Additionally, one of the most alarming statistics is that the 2020 season was the fifth consecutive above average Atlantic hurricane season from 2016 onward. Based on past weather patterns, we can expect future hurricane seasons to be just as active, if not more so, in the coming years.

If the expectation is that we are going to continue to see active hurricane seasons, it is imperative for insurance companies to have quick and reliable access to key data points as they are assessing damages, processing claims, and answering important questions such as:
- What were the maximum sustained wind speeds at a particular location?
- What was the predicted storm surge and how did that measure up to recorded high-water marks?
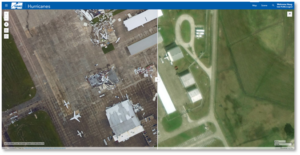
- What does before and after aerial imagery show for affected areas?
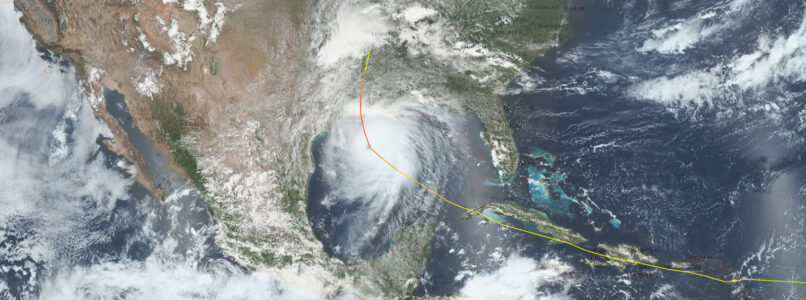
- How does the path of one storm compare to the paths of previous storms?
- Was there overlapping damage and if so, which storm caused which damage?
These questions are just a few examples of what needs to be answered quickly after a storm occurs. While there are a number of trusted and valuable resources that provide this data to the public (National Hurricane Center, National Centers for Environmental Information, NOAA’s Emergency Response Imagery), it can be very time-consuming and often confusing trying to locate and aggregate data from multiple websites. Then when a relevant data point is found, it can be difficult to visualize that data against other datasets you have for the project. Haag Technical Services (HTS) saw an imperative need to streamline how these datasets are accessed and viewed, which is why we created the Haag Hurricane Geoportal.

The Haag Hurricane Geoportal overlays multiple datasets compiled from several trusted and useful hurricane-related sources into one web mapping application. Users can see the track of a hurricane, what the predicted wind swaths were, and how those compare to satellite and radar imagery. They can also access valuable Local Climatological Data (LCD) weather reports from airport and other local weather stations. These reports are significant because they provide key data points related to a storm such as hourly precipitation, wind speeds, direction, gusts, and much more. If a user needs to see before and after imagery of a storm, the Haag Hurricane Geoportal has a slider tool that allows for impactful visualizations of imagery obtained by NOAA’s Remote Sensing Division. Users can also see how different hurricane tracks from earlier in the season (or from a previous season, if needed) overlap with current storms and which areas were most affected. Additionally, forecasts from future storms can be added to show where a hurricane is predicted to make landfall.
Perhaps the most useful tool within the Haag Hurricane Geoportal is the ability for users to see their own project-specific data as it relates to storm data. Imagine being able to view client locations and where possible claims could occur in relation to a storm’s track and wind swath in near real time. Then after the storm dissipates, imagine having access to LCD reports, high water marks compared to storm surge, and aerial imagery all within just a few days of when the storm occurred. This type of information is invaluable when deciding where to dispatch teams to review damages so that claims can be processed quickly and efficiently.
Haag Technical Services believes that there is no such thing as too much data as long as the data is organized, relevant, and easy to access. The Haag Hurricane Geoportal checks these boxes and so much more. It gives power to the user to view multiple datasets and decide which information they need for their project in order to efficiently complete their tasks. While we can’t stop severe weather from happening, we can create tools to help make proactive planning and recovery much easier.
If you would like to learn more about the Haag Hurricane Geoportal, please contact Marcie Deffenbaugh (mdeffenbaugh@haagglobal.com) for more information.

Marcie Deffenbaugh is the Manager of GIS Services for Haag Technical Services, a division of Haag Global, Inc. In this role, Ms. Deffenbaugh oversees initiatives related to GIS planning, system design, and system administration. She also manages a staff of GIS technicians, analysts, cartographers, and project administrative assistants who provide data validation and project management services for oil and gas clients. As the primary liaison between the client management teams and Haag Technical Services personnel, Ms. Deffenbaugh provides technical consulting services on a regular basis.
___
Any opinions expressed herein are those of the author(s) and do not necessarily reflect those of Haag Technical Services, Haag Engineering Co., Haag Education, or parent company, Haag Global, Inc.