Effects of Hail-Caused Dents on the R-value of Roof Insulation
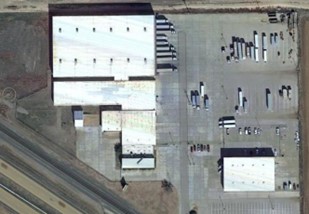
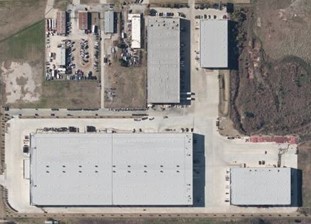
The subject property was a distribution center in Texas with several large buildings covered with single-ply, thermoplastic polyolefin (TPO) membrane roofs installed over various substrates. Concerns were raised regarding hail-caused damage to the roofs and the effects hail-caused dents had on the thermal properties of the insulation. A Haag engineer performed the roof inspection and provided samples of the TPO membrane and insulation substrates to our laboratory to determine if hail-caused dents in the substrates had reduced the insulation R-value.
Figure 1: Overview of property
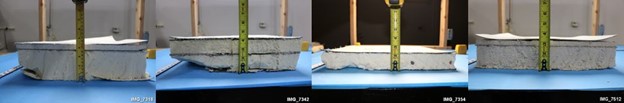
Four substrate samples were provided to our laboratory. Substrates included various thicknesses of polyisocyanurate insulation (polyiso), including two topped with gypsum coverboard. Table 1 summarizes substrate configurations.
Table 1: Sample Descriptions
Sample
Substrate
1
1/2-inch gypsum coverboard over 3-1/2 inches of polyiso
2
4 inches of polyiso
3
2 inches of polyiso
4
1/2-inch gypsum coverboard over 2-1/2 inches of polyiso
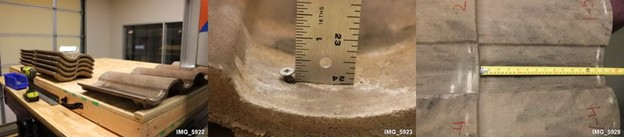
Figure 2: Samples 1 through 4 (left to right)
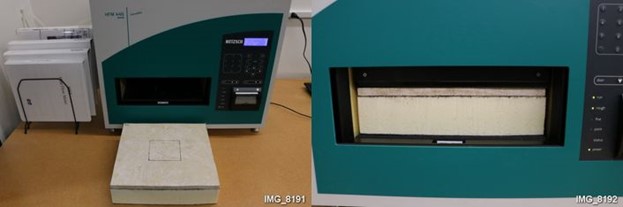
Each substrate sample contained a hail-caused dent centered on the sample. Laboratory personnel prepared each sample for R-value testing by conditioning in a laboratory oven to remove any residual moisture (absorbed humidity) and trimmed the samples to fit inside our heat flow meter (HFM), which is used to perform ASTM C518 – Standard Test Method for Steady-State Thermal Transmission Properties by Means of the Heat Flow Apparatus. Samples were then tested to determine their baseline R-values.
Figure 3: Sample 3 prepared to insert into the HFM (left) and inside the HFM (right)
Test parameters were chosen such that the bottom of each sample was in contact with a cold plate set at 75 degrees Fahrenheit and the top surface of each sample was in contact with a hot plate set at 145 degrees Fahrenheit. These temperatures were selected in accordance with ASTM C1058 – Standard Practice for Selecting Temperatures for Evaluating and Reporting Thermal Properties of Thermal Insulation because they represent in service temperatures of a roof on a hot summer day (upper plate) and a conditioned space below the roof (lower plate).
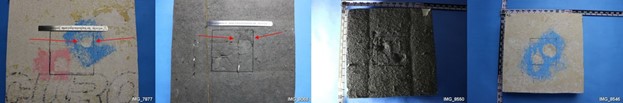
After baseline R-values were measured, a single dent was added to each sample that was similar in size and depth as the existing hail-caused dents and the R-values were remeasured. Test results are summarized in Table 2. The measured R-values after denting were then compared to the baseline R-values. Review of the measured R-values revealed the differences in R-value in the dented configurations versus baseline values for each sample fell within the accuracy of the HFM, which is +/- 2%.
Figure 4: Samples 1 through 4 (left to right) after adding dents
Table 2: Measured R-values
Sample
R-value (Baseline)
R-value
(After Denting)
Difference (percent)
1
12.62
12.48
-1.1
2
16.05
16.05
0.0
3
8.76
8.75
-0.1
4
11.07
11.05
-0.2
An additional consideration, is the R-value measurements taken within the HFM are made within a 4-inch by 4-inch region (metered region) in the center of the HFM. Also, one dent in the insulation is the smallest number of dents that can be measured for comparison. One square of roofing (100 square feet) is 900 times larger than the metered region within the HFM. For this reason, the differences in R-values listed in Table 2 represent a hail dent frequency of 900 hail-caused dents per square. The engineer that performed the roof inspection reported between two and seven hail-caused dents per square in the various substrates. Consequently, the hail-caused dents had no measurable effect on the R-value of the insulation.
The subject property was an apartment complex in Florida. Roofs were covered with Spanish-profile, concrete roof tiles. Concerns were raised regarding wind-caused damage to the roof tiles and specifically, what minimum wind speed could potentially displace the tiles. An inspection of the roofs was conducted by an outside roof consultant (non-Haag).
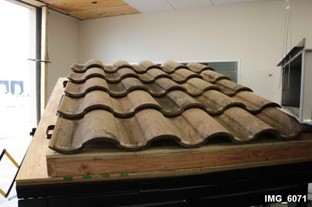
The client provided exemplar roofing tiles to our laboratory and detailed the tile installation at the site. Tiles were installed atop plywood roof decking, supported by wood battens, and mechanically attached with 2-1/2 inch long screws. Test panels were constructed, and tiles were installed to replicate tile installation at the property.
Figure 1: Tiles installed on a 5-corse test panel
Figure 2: Tile installation including fastener head stand-off and tile exposures
Tiles were tested in substantial conformance with ASTM D3161 – Standard Test Method for Wind Resistance of Steep Slope Roofing Products (Fan-Induced Method). Test panel configurations were modified as permitted by ASTM D3161 to develop additional information, including variations in slope angle, orientation to the wind stream, and fastened condition. A summary of test configurations is provided in Table 1.
Table 1: Tile Test Configurations
Fasteners
Test No.
Deck Slope
Orientation to Wind
Stream (degrees)
Field
Top Course
1
2:12
0
A
B
2
4:12
0
A
B
3
4:12
30
A
B
4
4:12
60
A
B
5
4:12
0
C
B
A
one screw with 1/4-inch stand-off
B
one screw flush with tile surface
C
no fasteners in field, bottom course left with condition A
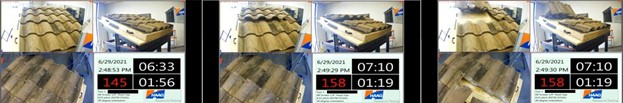
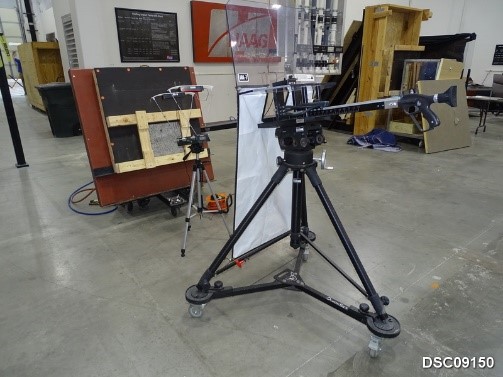
Our wind generator was programmed to ramp to 40 miles per hour (mph) in 60 seconds, then linearly ramp to 170 mph over 390 seconds (6-1/2 minutes), giving an average ramp speed of 10 mph every 30 seconds after the initial 60 second ramp. The wind generator program was manually terminated if/when a failure condition was reached. Tests were recorded using three video cameras in the test room, including an overhead view, a side view, and an angular view, to visually document the effects the wind stream had on the tiles. Wind speed in miles per hour (mph) was superimposed on the video stream providing a real-time correlation between wind speed and test conditions.
Table 2: Test Results
Wind Speed at Critical Moments (mph)
Test No.
First Tile Movement
Field Tile Lift
Field Tile Displacement
Lift-to-Displacement Differential (mph)
1
143
145
145
0
2
141
147
147
0
3
137
145
158
13
4
131
144
149A
5
5
124
138
139
1
Note A:
Tiles lift, shift, and hold, but do not separate from deck at max speed
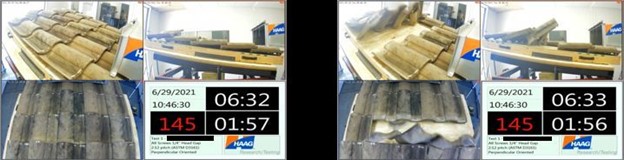
Figure 3: Test 1 screen shots before lift and after failure (left to right)
Figure 4: Test 2 screen shots before lift and after failure (left to right)
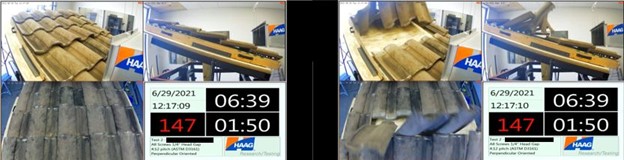
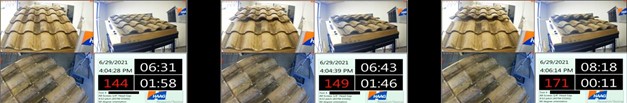
Figure 5: Test 3 screen shots before lift, start of failure, and after failure (left to right)
Figure 6: Test 4 screen shots before shift, start of shift and maximum shift (left to right)
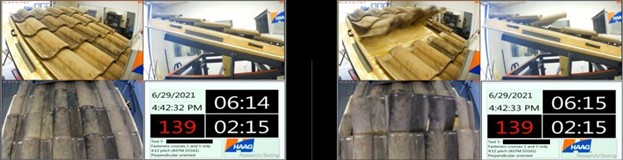
Figure 7: Test 5 screen shots before lift and after failure (left to right)
Testing demonstrated tiles installed in the same manner as they were at the subject property could be displaced by wind speeds of 147 mph and unfastened field tiles could be displaced by wind speeds of 139 mph. Testing also showed wind approaching from different angles (offset by 30 degrees and 60 degrees) would have minimal effect on tile performance, requiring slightly higher wind speeds to displace tiles. Importantly, testing also showed that wind speed sufficient to barely lift the tiles would rapidly displace the tiles. This is due to the aerodynamics changing as air is allowed to impinge on the bottom of tile surfaces once lifting occurs.
Desaturation Testing of Modified Bitumen Roofing Membrane
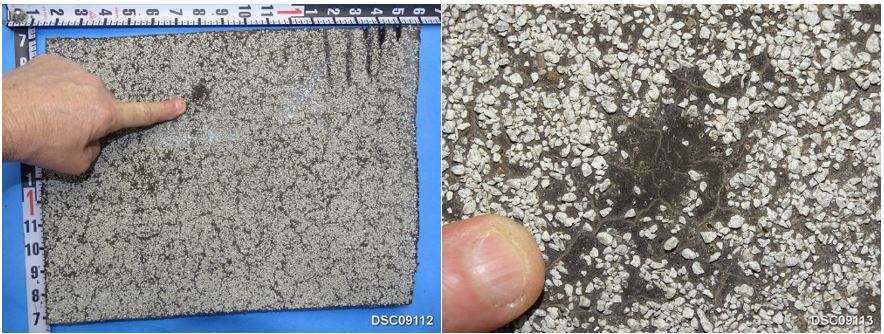
Manufacturing facility with several large buildings covered with granule surfaced modified bitumen (mod-bit) roofing membranes. Concerns were raised regarding hail-caused damage to the roofs. The mod-bit roofs varied in age and had numerous regions where granules were missing that were presented as examples of hail-caused damage. Our client needed to know if the roofs had been damaged by hail.
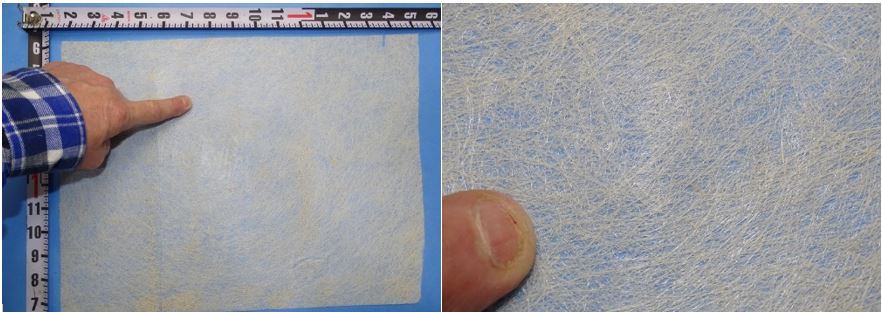
Mod-bit roofing samples and their substrates were removed and tested in the HRT laboratory to determine if regions of missing granules were caused by hailstone impacts and to determine if the roofing samples had been damaged by hail. Samples were visually and tactilely examined by laboratory personnel and then samples were processed via hot solvent desaturation, which removes the bitumen and surfacing, allowing the reinforcements to be closely examined for ruptures or strains consistent with hail impact forces.
Overview of property
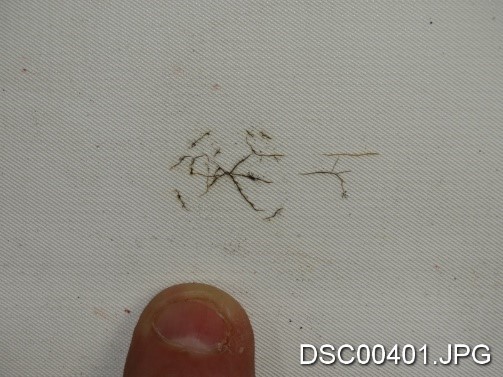
Area presented as being related to a hailstone impact (left) and close-up (right)
Prior to desaturation, the samples and substrate taken from the roof were mounted to a panel and impact tested with various sizes of ice balls. Ice balls were frozen solid and propelled perpendicular to the test panel at free-fall velocities of similar sizes of hail to replicate worst-case impact conditions.
Sample and substrate mounted to test panel for hail simulation testing
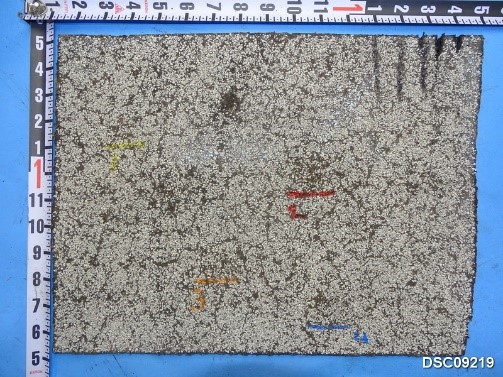
Sample after impact testing with ice balls to simulate hailstone impacts
After impact testing, reinforcements were examined at the area of interest (See Figure 2) for conditions related to hailstone impact. The reinforcements were intact. Additionally, the area of interest was visually dissimilar to areas impacted by simulated hailstones.
Base ply reinforcement was intact at the area of interest after desaturation
Regions of the reinforcements subjected to simulated hailstone impacts were also examined after desaturation. It was determined that frozen solid hailstones of about 1-3/4 inches in diameter or larger could bruise the mod-bit roofing, which was a condition not detected in the field or during laboratory examination.
Simulated Hail Impact Testing of PVC Roofing Membrane
Large school with numerous roof sections covered with a variety of single-ply roofing membrane types. One section covered with a relatively new thermoplastic polyolefin (TPO) membrane, several large sections covered with old polyisobutylene (PIB) membranes, and several sections covered with polyvinyl chloride (PVC) roofing membranes estimated at about 10 years old. School had been struck by hail on numerous occasions and the roof was examined for hail-caused damage. Some of the PVC roofing had obvious hail-caused damage and our client needed to know when the hail-caused damage had occurred.
Samples of the PVC roofing were removed and tested in the HRT laboratory to determine the minimum size of hail that could damage the PVC membranes and to determine what size hail would create similar size fractures in the membrane and similar dents in the insulation. Samples and substrate taken from the roof were mounted to a panel and impact tested with various sizes of ice balls. Ice balls were frozen solid and propelled perpendicular to the test panel at free-fall velocities of similar sizes of hail to replicate worst-case impact conditions.
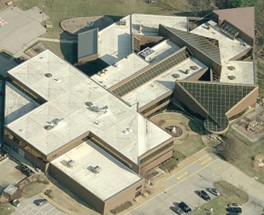
Overview of campus
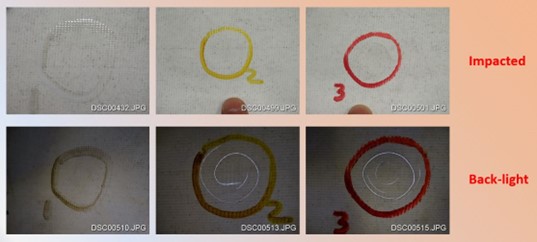
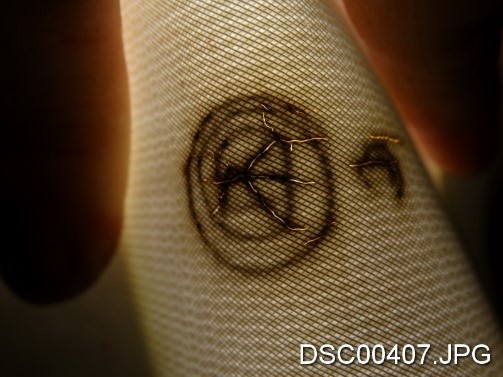
Hail fracture on bottom of PVC membrane
Hail fracture on bottom of PVC membrane with backlighting
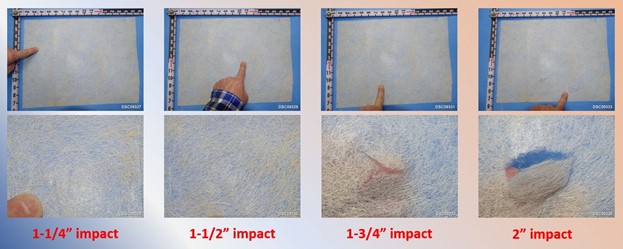
Based on simulated hail impact testing, the minimum size of hail that could cause similar impact damage to the PVC membranes was 1-1/4 inches in diameter. Based on a review of weather records, information gathered during our inspection, and laboratory test results, there was one specific storm that could have caused the fractures in the PVC membranes.
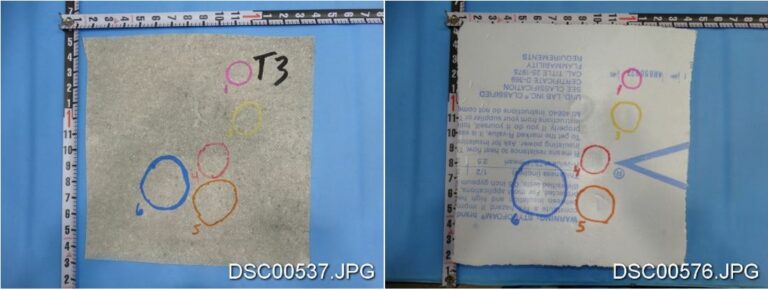
Impacts from ice balls measuring 1, 1-1/4, and 1-1/2 inches in diameter (left to right)
Simulated hail impacts used to compare dents in insulation
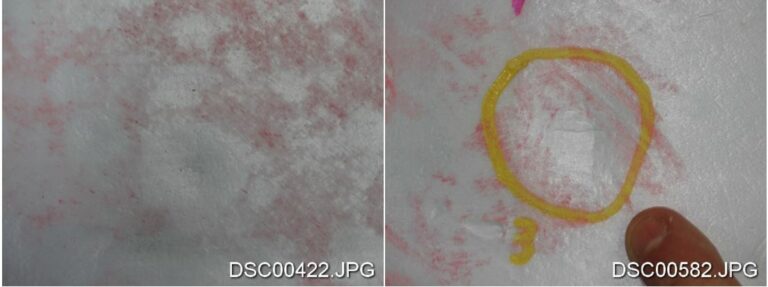
Hail-caused dents in the insulation were consistent in size and depth as dents resulting from simulated hailstone impacts made with ice balls measuring 1-1/4 inches in diameter, corroborating the hail-caused damage to the PVC roofing membranes were likely caused by hailstones measuring about 1-1/4 inches in diameter.
Hail dent in insulation (left) and similar dent with 1-1/4 inch diameter ice ball (right)