Category: Featured Post

Real-Time, Interactive Storm Data: Haag Hurricane GeoPortal, Sept. 2022

HURRICANE GEOPORTAL: real-time, INTERACTIVE storm data

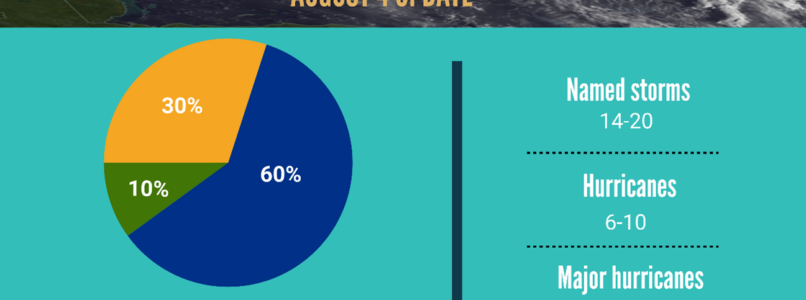
According to the National Oceanic and Atmospheric Administration’s (NOAA) annual mid-season update issued by the Climate Prediction Center, atmospheric and oceanic conditions still favor an above-normal 2022 Atlantic hurricane season. NOAA’s update to the 2022 outlook — which covers the entire six-month hurricane season that ends on November 30th — calls for 14-20 named storms (winds of 39 mph or greater), of which 6-10 could become hurricanes (winds of 74 mph or greater). Of those, 3-5 could become major hurricanes (winds of 111 mph or greater). NOAA provides these ranges with a 70% confidence.
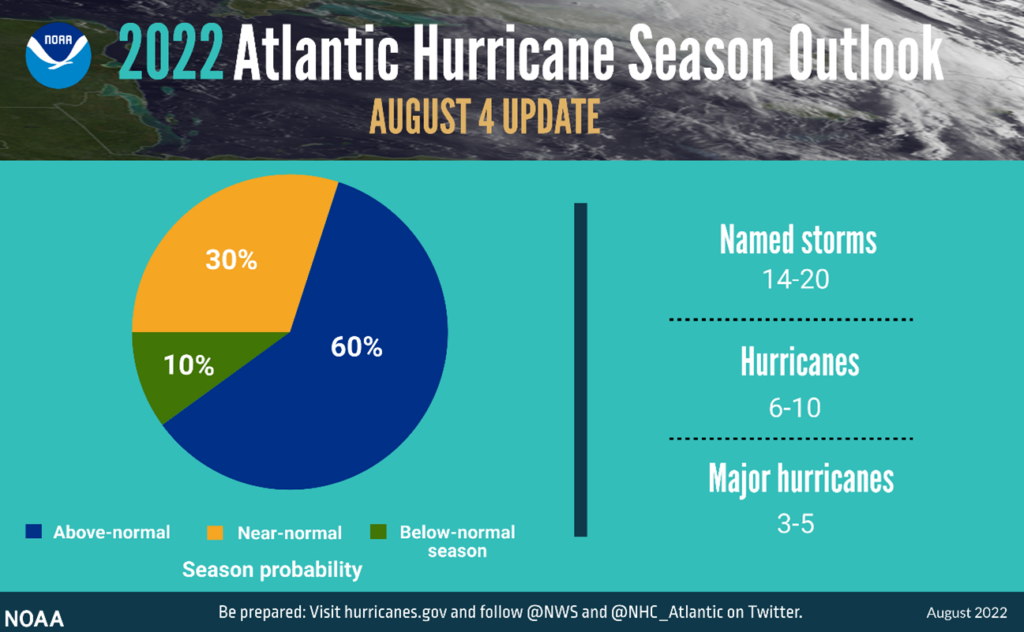
The updated 2022 Atlantic hurricane season probability and number of named storms.

Considering this outlook for 2022 as well as very active recent hurricane seasons, it is imperative for businesses and individuals to have quick and reliable access to key data points. Haag believes that there is no such thing as too much data if the data is organized, relevant, and easy to access. The Haag Hurricane Geoportal checks these boxes and much more. It gives power to the user to view multiple datasets, interact with the data, and decide which information is most valuable to them. The Haag Hurricane Geoportal utilizes a map-based interface to provide on-demand access to several useful data sources including:

  • Real-time data for active and recent storms from the current hurricane season
  • Detailed storm data from the past three hurricane seasons with options to filter data based on storm name
  • Wind speeds and pressure at observed positions along a storm’s path
  • Direct access to official National Hurricane Center (NHC) storm reports
  • Radar and aerial imagery data for storms
  • Access to local climatological data reports
  • NEXRAD radar mosaics for current and past storms
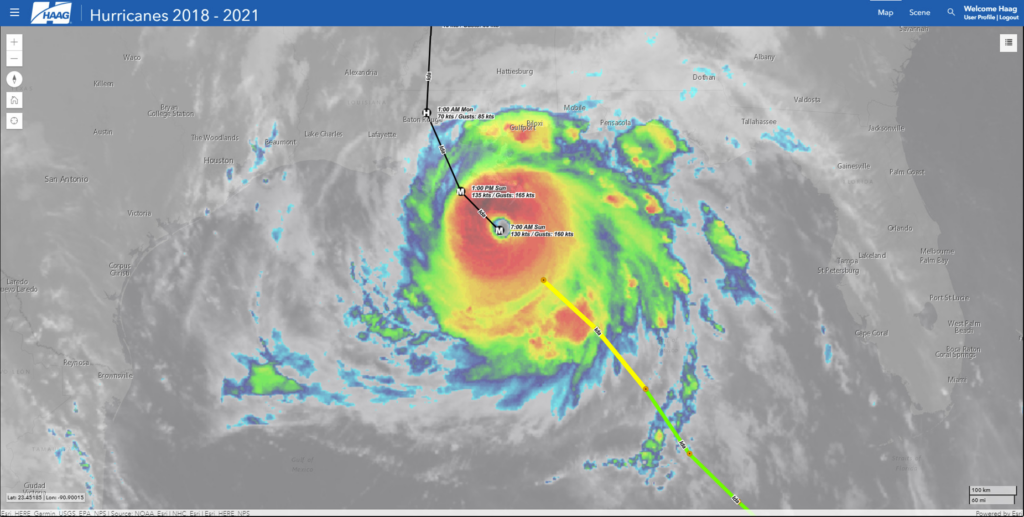
Satellite imagery, observed track and positions, forecasted track and positions of Hurricane Ida, August 2021.
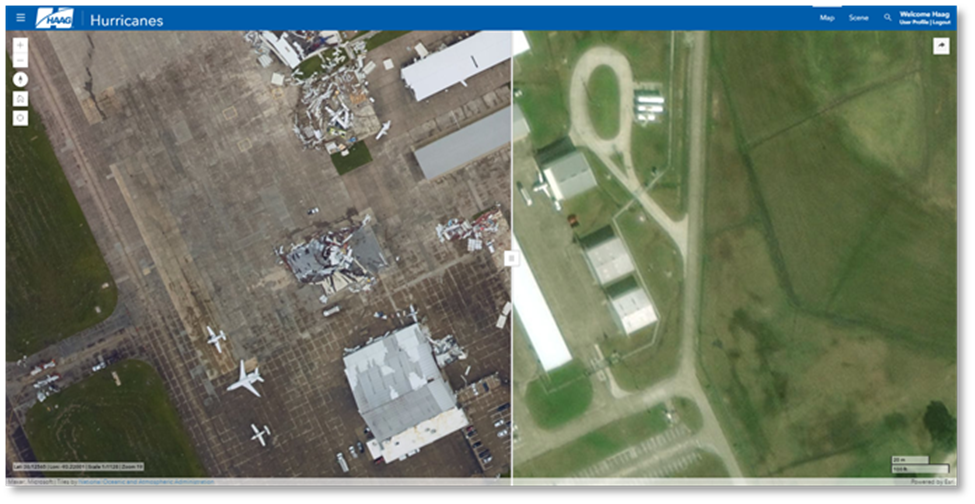
Before and after aerial imagery showing damages caused by Hurricane Laura, August 2020.

The Haag Hurricane Geoportal provides timely access to reliable data in one easy-to-use platform. While we can’t stop severe weather from happening, we can create tools to help make proactive planning and recovery much easier. The Hurricane Geoportal is your one-stop shop for keeping an eye on the data for the eye of the storm.

If you would like to learn more about the Haag Hurricane Geoportal, please contact Marcie Deffenbaugh, GIS Services Manager, to view a demo or for more information. Haag’s Hurricane Geoportal is available via subscription– one year subscription for $50/month or opt for a month-to-month subscription for $75/month.
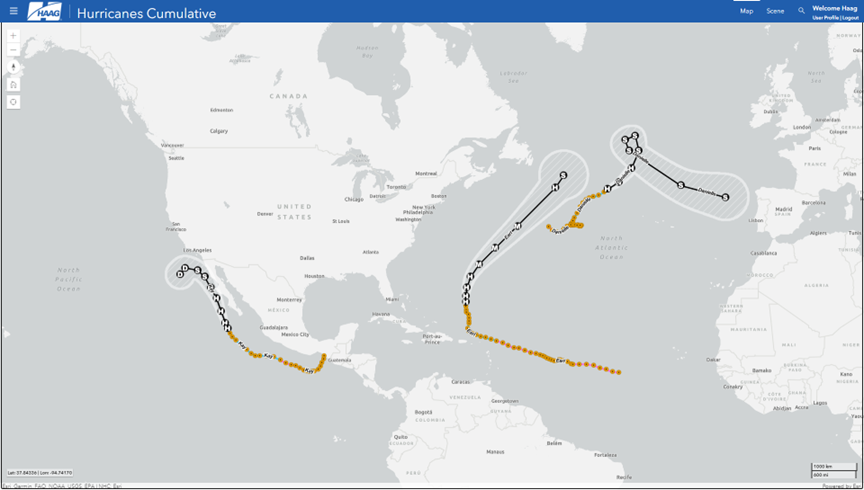
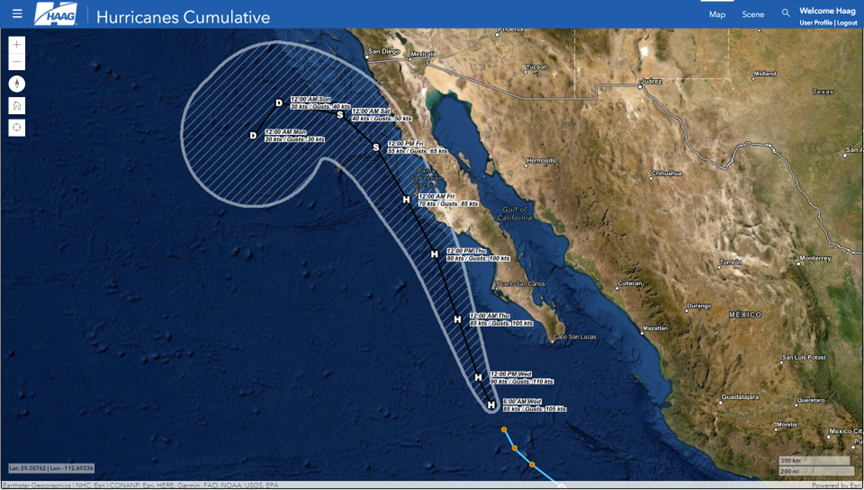
View of observed tracks and positions, as well as forecasted tracks, positions, and error cones of active storms as of 10:00 AM EST on 9/7/2022.
View of Hurricane Kay with forecasted track, position, and error cone as of 10:00 AM EST on 9/7/2022.

Marcie Deffenbaugh is the Manager of GIS Services for Haag Technical Services, a division of Haag Global, Inc.  In this role, Ms. Deffenbaugh oversees initiatives related to GIS planning, system design, and system administration. She also manages a staff of GIS technicians, analysts, cartographers, and project administrative assistants who provide data validation and project management services for oil and gas clients. As the primary liaison between the client management teams and Haag Technical Services personnel, Ms. Deffenbaugh provides technical consulting services on a regular basis.

___

Any opinions expressed herein are those of the author(s) and do not necessarily reflect those of Haag Technical Services, Haag Engineering Co., Haag Education, or parent company, Haag Global, Inc.

Congratulations Daniel Behrens, Promoted to Principal Engineer

Haag is very pleased to announce that Daniel Behrens, P.E., has been promoted to Principal Engineer! Based in Minneapolis, Dan Behrens has been a Haag Engineer for 13 years, with 24 years in the engineering field. He has been instrumental in serving Haag’s clients in Minneapolis, the Midwest, and beyond. Dan is a prolific course developer and a reliable ‘go-to’ engineer who is always willing to mentor new engineers and take on challenging assignments. Congratulations on this well-deserved promotion Dan!

Welcome Alex DeGroot, P.E., New Engineer in Charlotte!

Haag Welcomes Alex DeGroot, P.E., New Engineer in Charlotte!

“We are pleased to welcome Alex DeGroot to our Haag team,” said Justin Kestner, CEO. “Mr. DeGroot brings practical structural engineering expertise and will help serve Haag’s clients in North and South Carolina and beyond.”

Based out of Charlotte, Alex is a licensed professional engineer with seven year’s experience. He previously worked as a structural engineer designing wood, steel, masonry, CFS, FRP and reinforced concrete structures. He evaluated existing conditions, identified causes of problems, and provided engineered solutions. He then coordinated with clients, steel fabricators/erectors, and general contractors to identify potential issues and implement cost effective solutions, including developing solutions for atypical field issues with multiple constraints and limitations.

Mr. DeGroot earned a Master of Structural Engineering from Southern Illinois University and a Bachelors of Science in Civil Engineering from Bradley University. He is a licensed P.E. in North Carolina. 

Notable projects include–

  • Goddard School, Chicago- coordinated with the architect from design to construction administration for the $5 million three-story private school
  • Illinois State Toll Highway Authority Contract I-18-4427, Chicago- designed performance-based, ground-mounted and structure-mounted precast concrete noise abatement walls for the $58 million contract
  • SoFi Stadium, Los Angeles– analyzed six construction hoists for the $5 billion stadium using atypical tie-off methods and custom connections.

Primary Areas of Consulting

  • Structural Evaluations
  • Commercial, industrial, and residential buildings 
  • Foundation and wall failures
  • Building code compliance
  • Construction hoists
  • Noise abatement walls
  • Building Envelope Evaluations
  • Moisture intrusion
  • General Civil Engineering
  • Drainage and flooding
  • Wind Engineering and Related Storm Effects
  • Structural damage
  • Roofing systems 
  • Quality of manufacture and application of roofing
  • Cause, nature, and extent of damage, particularly from hail and wind; and remaining service life

For more information or to contact Mr. DeGroot, email or call 800.527.0168.

Electrical Surge or Lightning? – May 2022

Electrical Surge or Lightning?

When electrical damage occurs, determining the cause of the event is an important topic for insurance claims. Electrical damage can occur from lightning events, electrical surge from power utilities, water contact, fire events or other electrical malfunctions in the equipment.

Power outages were widespread during the winter storm in 2021.  A power outage can lead to an electrical surge event when power is restored to the home. A safe method to avoid electrical surge damage to equipment is to unplug electrical appliances and devices during a power outage. Turning off circuit breakers is an additional protection to avoid electrical surge damage when power is restored. Power surge suppressors are also a cost-effective addition to electrical distribution panels. Electrical surge can be easier to classify if lightning is not present in the area.

Lightning is a naturally occurring event that can cause severe electrical damage to electrical equipment. Lightning events are well documented occurrences with data measured by the National Lightning Detection Network and other companies. Each network uses hundreds of sensors placed throughout the United States and adjacent countries to collect their data.

Lightning strikes can be classified in a few different ways. A cloud-to-ground lightning strike(stroke) is an electrical discharge between the atmosphere and the ground.  A cloud-to-cloud lightning event is not typically recorded by lightning detection networks. Lightning stroke data includes the date/time, latitude/longitude, peak amplitude, polarity, and determination of whether it was a cloud-to-ground or cloud-to-cloud strike.

A search diameter between 1 to 15 miles is available for most lightning report services. Most lightning network data can detect a strike within seconds of the event occurring with a near 100 percent detection of thunderstorms.  If a lightning detection network report shows no lightning in that location on the day in question that information is very accurate.

For address-specific applications of lightning data, the ability to detect a thunderstorm is not the same thing as detecting every single stroke that contacts the ground.  All networks have a flash detection efficiency of 90-95 percent or greater for cloud-to-ground lightning.  In general, the networks may not record the smallest magnitude lightning strikes accurately.  In addition, during intense thunderstorms when there are many strikes, the sensors can be processing data and resetting after a flash when the next flash occurs, and they may not see the second flash.

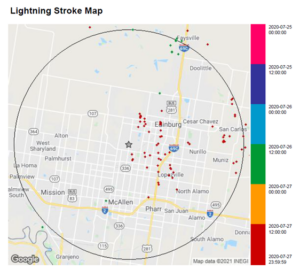
All US lightning networks state their median location accuracy is about 1/8 mile.  A large campus property doesn’t generally affect the interpretation of results.  However, for homes in a heavily populated area the 1/8-mile radius around the reported strike point could encompass a number of separate houses. So, while there is a 95 percent chance that the lightning actually struck within approximately 1/8 mile of the pinpoint shown on the data map that might not be at the house selected as the center of the data area.  This image shows a point data map with a 10-mile search radius.

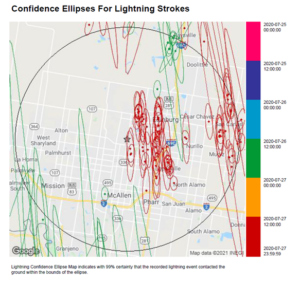
The accuracy of the location is dependent upon the number of sensors that “see” the flash and their locations.  The greater number of sensors that detect a stroke, the more accurately that stroke will be plotted. The fewer sensors that detect the stroke will have a larger error and this will be visualized with a more elliptical or oval shape.  This is illustrated by comparing the point data on the Lightning Stroke Map above with the same data as presented on the Confidence Ellipses map below.  So rather than the strike point always being within 1/8 mile of the point shown on the map in the data report, the actual strike point could be several miles away in the worst cases.  These ellipses have a 99 percent of encompassing the actual strike point.  This image shows the same point data map with the 10 mile search radius with the 99 percent confidence ellipses shown.  Note the large size of some of the ellipses.

In summary, a lightning data report is very accurate when evaluating lightning presence in the area of interest on the date and time of interest.  However, the exact location of the strike may not be as obvious as the reports present.  In these cases, it is important to use information from the scene, including physical evidence and expert evaluation, to determine if lightning actually struck the property or caused damage at the property.


ANDREW LYNCH P.E., CFEI, CVFI, is an Engineer at Haag Global. He has provided expert testimony in cases involving electrical and mechanical damage. Mr. Lynch has taught numerous training sessions on Electrical Engineering to adjusters. He has also presented at various conferences and claims association meetings. Prior to joining Haag, Mr. Lynch was primarily involved in forensic engineering for many years. He also has prior experience in the design and software of robotics, oilfield equipment and medical devices.


Any opinions expressed herein are those of the author(s) and do not necessarily reflect those of Haag Global, Inc., Haag Canada, or any Haag companies.