Category: Articles

Celebrating a Century of Forensic Engineering

Haag 100 Year Anniversary - A century of forensic innovation

setting the standard for 100 years: a legacy of forensic innovation

As we kick off 2024, we are thrilled to share a momentous milestone – our 100th year anniversary! For a century, Haag Global has stood at the forefront of innovation, setting the standard as the oldest forensic engineering and consulting firm in the United States. We are proud to be a trusted leader in the field, providing cutting-edge solutions and critical insights to clients from various industries.

President and CEO, Justin Kestner, remarks, As we proudly celebrate 100 years of Haag, we honor the legacy of those who have contributed to our success – our dedicated team, loyal clients, and valued industry partners. Thank you for being a part of our journey. Our commitment to quality and integrity and our team-oriented culture have been the driving forces behind our longevity. Looking ahead, we are excited about the future and advancing the highest standards in forensics and failure and damage consulting.”

Haag 100 Year Anniversary Logo

Haag Global: shaping the future of forensics

Since our founding in 1924, Haag has been a pioneer in the field, shaping the landscape of forensic engineering and consulting. From humble beginnings in Dallas, Texas to a nationwide presence, including Puerto Rico, and now internationally including Canada, our history has been marked by resilience, adaptability and dedication to providing scientific and precise solutions for our clients.

At the heart of our success is a team of passionate professionals who have tirelessly worked to bring understanding and resolve to complex engineering and technical challenges. Our legacy encompasses a diverse range of services, each contributing to our standing as an industry leader ­in forensic engineering, forensic architecture, forensic meteorology, construction consulting, fire origin and cause, forensic research and testing, education courses and training and technology solutions.

A century of Employee-Owned Excellence

Paramount to Haag Global’s success is our commitment to employee ownership – a cornerstone of our company culture. We take pride in fostering a workplace where integrity, quality, service, and our employee growth, recognition and ownership are not just values but a way of life. As an employee-owned firm, every member of our team is invested in delivering top-notch services and delivering on Haag’s mission. 

Haag's mission: Delivering execellence with Integrity

Our mission is clear – deliver independent and industry-leading consulting services with integrity and time-tested expertise. It’s not just a statement; it’s a promise. As we move into the next century of continuing Haag’s mission, our commitment to quality, integrity, and innovation remains stronger than ever. We are poised to embrace new challenges, adapt to evolving industries, and provide cutting-edge solutions that will shape the future of forensic engineering and consulting.

Our dedication to excellence and innovation will drive us forward, ensuring that Haag Global remains a trusted partner to our clients for the next 100 years. For a deeper look into the rich history of Haag, check out our company timeline. Throughout 2024, we will continue to share insights into the events that have shaped our company and how we plan to build on that foundation moving forward. 

A Dynamic Shift in Severe Weather Warnings, November 2023

By Patrick Hyland, CCM, Senior Forensic Meteorologist

Storms move, shouldn’t the warnings move with them?

With 122 local National Weather Service (NWS) Forecast Offices covering the United States and its territories, NWS forecasters are responsible for protecting life and property through the constant surveillance of the atmosphere and issuing life-saving weather warnings when severe weather strikes.

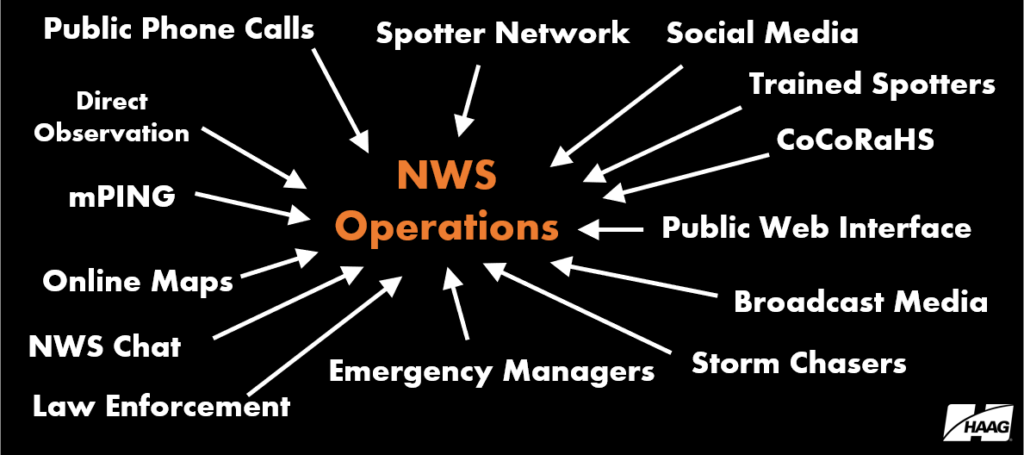
When a weather warning is generated, a polygon is issued by the local NWS across the area for which the meteorologist believes the storm has the highest probability of producing severe weather. The creation of these warnings is typically based on observations from remote sensing systems like Doppler weather radar and other surface-based weather instrumentation, as well as public reports of severe weather via social media, email, or telephone.

Once the warning is issued, the storm moves through the warning polygon with time. As the storm nears the end of the polygon, the NWS forecaster must decide whether to issue a new polygon to continue warning subsequent locations ahead of the storm of a continuing threat for severe weather or cancel/allow the warning to expire due to a decreasing threat of severe weather. This piecemeal process for warning generation creates inequitable lead times for severe weather along the path of the storm – in particular for nearly adjacent locations that may fall within or just outside the warning polygon.

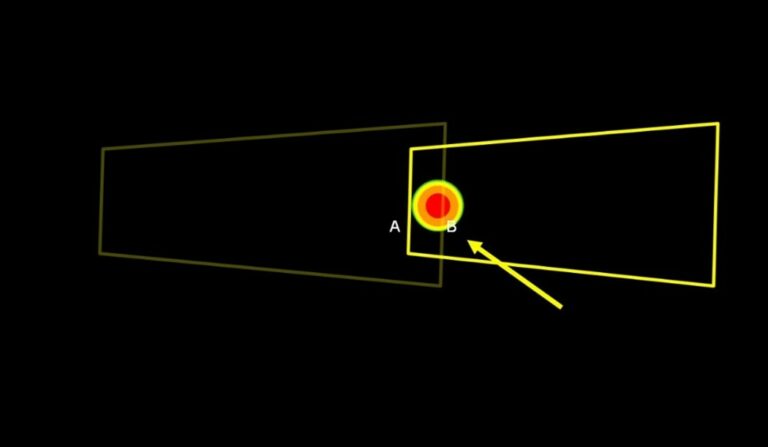
The red-target indicator illustrates a hypothetical storm (moving left to right), while the yellow polygons represent severe weather warnings (muted yellow polygon is the previous warning and the bright yellow polygon is the new warning). Note that locations A and B are nearly adjacent, yet the lead time for location A is greater than location B.

A proposed new method for warning generation is in the research and development phase that would transform static severe weather warnings to dynamic, continuously updating warnings that follow the storm. This concept, called Threats-in-Motion (TIM), is the first step in a larger initiative known as Forecasting a Continuum of Environmental Threats (FACETs) that aims to improve the forecast and warning process across all environmental hazards through the communication of probabilistic hazard information (PHI). Through several iterations of experiments with NWS forecasters utilizing archived and real-time weather scenarios, these moving warnings have been shown to create more equitable lead times and allow for improved communication as storms move downstream.

The TIM concept is expected to be introduced operationally to the NWS in phases. The first implementation that is closest to operational readiness is Tiny TIM, which will allow forecasters to extend the area and time of severe weather warnings while maintaining the same Event Tracking Number (ETN). In this regard, the forecaster can keep the same warning with the storm throughout its lifecycle – “one storm, one story” – which is especially useful with long-track, long-lived storms. Not only does Tiny TIM help reduce forecaster workload since the overall number of warnings decreases, but it will also help to eliminate overlapping warnings that can lead to communication issues in complex weather events. The capabilities of Tiny TIM will be extended with the future introduction of Taller TIM in which the warning will move continuously downstream at one-minute increments upon issuance until the forecaster intervenes to update the warning. Taller TIM creates even more equitable lead times for severe weather than Tiny TIM as well as improved departure, or “All Clear”, messaging. The final phase in this new warning paradigm will include PHI alongside these warning objects to communicate storm evolution, intensity, duration, and trend information. PHI has the potential to provide user-specific products that can be adapted to fit the needs of any individual or organization.

From Stumpf and Gerard (2021). Image shows the one-minute lead times along a hypothetical tornado path for current NWS warnings (blue), Tiny TIM (gray), and Taller TIM (orange). Note how lead time equitability improves with Tiny TIM compared to current NWS warnings, with even further improvement when utilizing Taller TIM.

One of the most critical elements required in the implementation of this new warning paradigm is dissemination. Through these experiments and testing, researchers are also engaging with emergency managers, broadcast meteorologists, and individuals throughout the weather enterprise from operations to the private sector to understand how to effectively relay moving, continuously updating warnings to the public. TIM represents a dramatic change in the way warning information is communicated, so it is vital to make sure that the infrastructure and partners are well prepared for the future of severe weather warnings in the United States.

Haag’s team of meteorologists have been involved in extensive field projects and research spanning the weather, water, and climate enterprise and continue to stay on top of advancements in the field. Our forensic meteorological services continue to expand and evolve with changes in our understanding of weather information. Contact one of our meteorologists today for your forensic meteorology needs.

For more information on the TIM concept, please refer to the included publication and website links:

Author

Patrick Hyland, CCM, Senior Forensic Meteorologist

Patrick Hyland, CCM, is a Forensic Meteorologist with Haag Engineering. Mr. Hyland has over 15 years of experience in meteorology, including ten years providing meteorological consulting services for a variety of cases where expertise is required. He most recently served as a Research Meteorologist with the NOAA National Severe Storms Laboratory (NSSL) Warning Research Development Division (WRDD). He was responsible for developing cutting-edge tools, algorithms, products, and techniques to improve the warning-decision-making process for use in operational National Weather Service (NWS) Forecast Offices for the protection of life and property. He focused on radar severe weather applications, probability and impacts research, and the Multi-Radar Multi-Sensor (MRMS) system.


Any opinions expressed herein are those of the author(s) and do not necessarily reflect those of Haag Technical Services, Haag Engineering Co., Haag Education, or parent company, Haag Global, Inc.

Haag’s Hurricane GeoPortal- Interactive Storm Data, Oct. 2023

Haag’s HURRICANE GEOPORTAL: timely access to reliable data

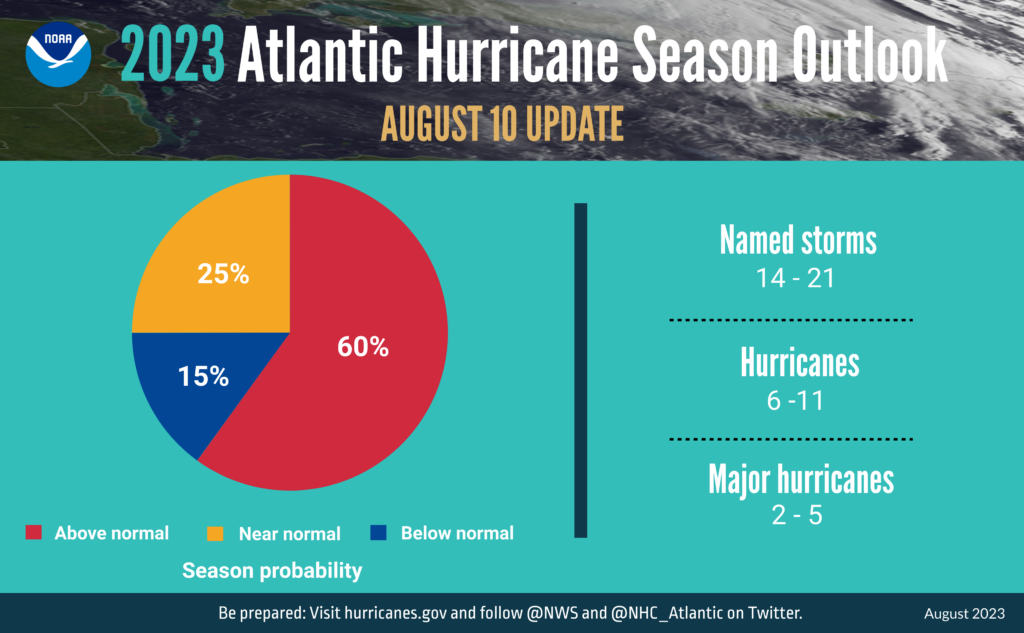
In August, NOAA’s Climate Prediction Center (a division of the National Weather Service), updated their 2023 hurricane outlook. “Due to current ocean and atmospheric conditions, such as record-warm sea surface temperatures, NOAA’s Climate Prediction Center has increased their prediction for the ongoing 2023 Atlantic hurricane season to an “above normal” level of activity from a “near normal” level with their most recent update.” NOAA now predicts “a 70% chance of 14-21 named storms, of which 6-11 could become hurricanes, and 2-5 could become major hurricanes.”1

In light of the outlook for 2023 and considering active recent hurricane seasons, it is imperative for businesses and individuals to have quick and reliable access to key data points. Haag believes that there is no such thing as too much data if the data is organized, relevant, easy to access, and easy to understand. Haag’s Hurricane Geoportal gives users the power to view multiple datasets, interact with the data, and decide which information is most valuable to them. The Haag Hurricane Geoportal utilizes a map-based interface to provide on-demand access to several useful data sources including:

  • Real-time data for active and recent storms from the current hurricane season
  • Detailed storm data from the past three hurricane seasons with options to filter data based on storm name
  • Wind speeds and pressure at observed positions along a storm’s path
  • Direct access to official National Hurricane Center (NHC) storm reports
  • Radar and aerial imagery data for storms
  • Access to local climatological data reports
  • NEXRAD radar mosaics for current and past storms
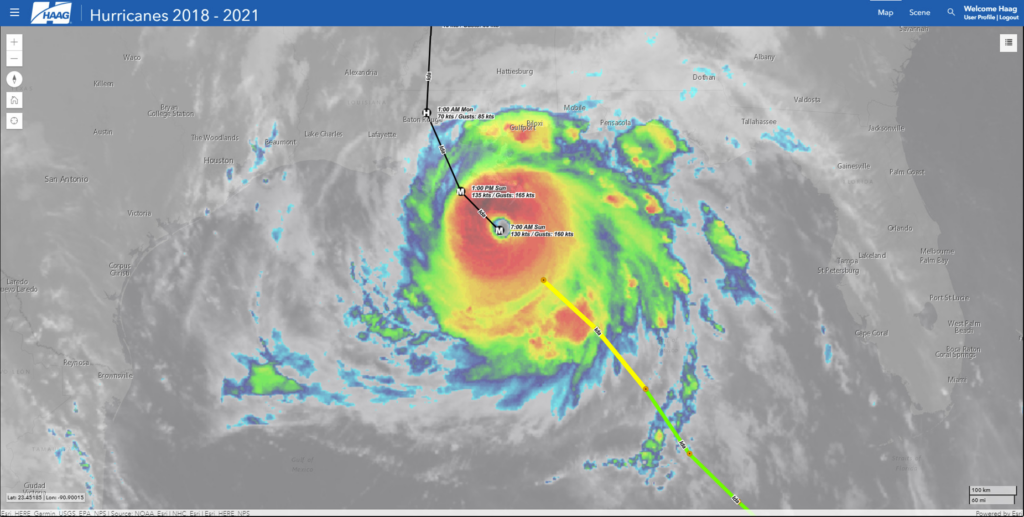
Satellite imagery, observed track and positions, forecasted track and positions of Hurricane Ida, August 2021.
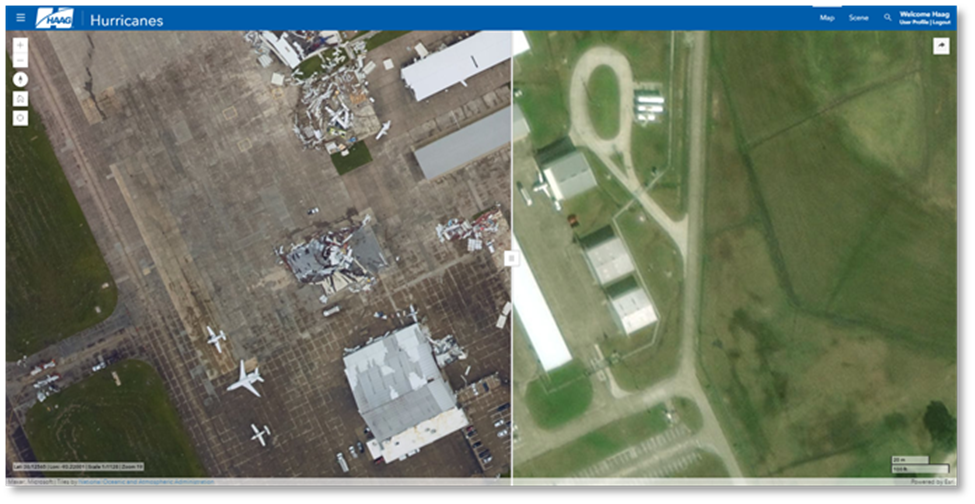
Before and after aerial imagery showing damages caused by Hurricane Laura, August 2020.

The Haag Hurricane Geoportal provides timely access to reliable data in one easy-to-use platform. While we can’t stop severe weather from happening, we can create tools to help make proactive planning and recovery much easier. The Hurricane Geoportal is your one-stop shop for keeping an eye on the data for the eye of the storm.

If you would like to learn more about the Haag Hurricane Geoportal, please contact Marcie Deffenbaugh, GIS Services Manager, to view a demo or for more information. Haag’s Hurricane Geoportal is available via subscription– one year subscription for $50/month or opt for a month-to-month subscription for $75/month.

1. Source: “NOAA Releases Updated 2023 Atlantic Hurricane Season Outlook” https://www.nesdis.noaa.gov/news/noaa-releases-updated-2023-atlantic-hurricane-season-outlook#:~:text=The%20outlook%20now%20includes%20a,the%20ongoing%20El%20Ni%C3%B1o%20event .)

Marcie Deffenbaugh is the Manager of GIS Services for Haag Technical Services, a division of Haag Global, Inc.  In this role, Ms. Deffenbaugh oversees initiatives related to GIS planning, system design, and system administration. She also manages a staff of GIS technicians, analysts, cartographers, and project administrative assistants who provide data validation and project management services for oil and gas clients. As the primary liaison between the client management teams and Haag Technical Services personnel, Ms. Deffenbaugh provides technical consulting services on a regular basis.

___

Any opinions expressed herein are those of the author(s) and do not necessarily reflect those of Haag Technical Services, Haag Engineering Co., Haag Education, or parent company, Haag Global, Inc.

Windows + Hurricanes, September 2023

By Brandon Bealmear, P.E., FMPC, Fenestrations Practice Leader, Forensic Engineer

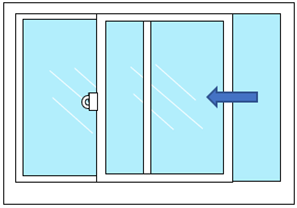
Windows are a barrier system infilled within openings in the wall of a building. Inherently, windows are exposed to contrasting environments on the interior from the exterior surfaces. Interior spaces are generally controlled and set to a standard temperature, while exterior environments are ever changing. Air and water travel through the path of least resistance which generally means through openings (windows) of a building envelope. Air filtration through windows can be from static differential pressure or dynamic wind forces. When these pressures become large enough, water can also infiltrate the joints particularly with operable components. Hurricanes combine extreme rainfall and high wind forces, creating the perfect storm that can be very challenging for window performance.

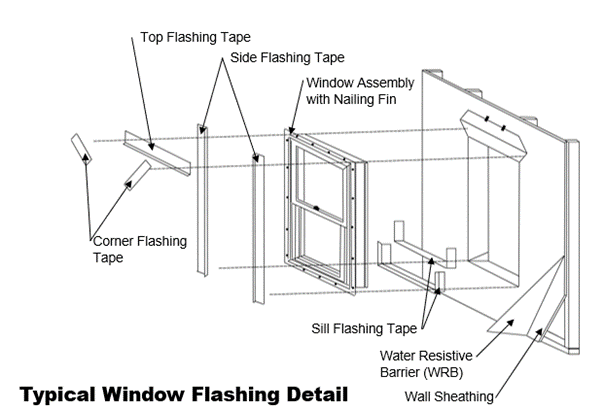
Window and door assemblies are designed to withstand specific wind loads without experiencing structural damage. However, the design pressures for structural integrity can greatly exceed the pressures against which the assemblies are qualified to resist water infiltration, thus leakage can occur through glazing components and weather-stripping without damage occurring to the window assembly. Leaks can also occur around the windows and doors, not necessarily always through the glazing or operable components of the system. Often, leaks around window and door assemblies develop over time through deteriorated flashing components or improperly flashed interfaces, indicative of installation deficiencies. Leaks may only be revealed to the interior during events with a high demand for water tightness such as when water is prevented from draining freely and/or heavy rainfall.

Building codes govern the selection of window assemblies to be used in a building. Both performance and testing parameters are included in all International Residential Codes and International Building Codes adopted nationally since the early 2000s, and some prior to that. Modern day codes specifically indicate that exterior windows and doors shall be capable of resisting the design wind loads specified for the geographical area of the building and be adjusted for height and exposure. Testing and labeling is also included in these codes which requires exterior windows and doors be tested by an approved independent laboratory, and bear a label identifying manufacturer, performance characteristics and approved inspection agency to indicate compliance with American Architectural Manufacturers Association (AAMA 101), Window and Door Manufacturers Association (WDMA I.S.2), and Canadian Standards Association (CSA A440); AAMA/WDMA/CSA 101/I.S.2/A440 (commonly referred to as AAMA 101).

Window assembly label example.

AAMA 101 provides guidance for rating windows and doors, which are described as performance grades (PG) and are based on the design wind pressure determined from the basic wind speed adjusted for height and exposure. Buildings in hurricane prone areas are commonly required to resist pressures induced by wind blowing more than 120 miles per hour, which translates to 40 or more pounds per square feet (PSF) or a PG40 rated window or greater.

Windows tested in accordance with AAMA 101 are required to pass a water penetration test using simulated rain and air pressure differential at 15 percent of the PG. Architectural type windows require 20 percent. Additionally, windows tested in accordance with AAMA 101 are required to pass a structural test with simulated air pressure at 150 percent of the PG. This means there shall be no permanent damage to glass, framing, fasteners, hardware, or other components of the window.

Major hurricanes are defined by the National Hurricane Center and National Oceanic and Atmospheric Administration to be a category 3 or higher on the Saffir-Simpson Hurricane Wind Scale. Sustained winds need to reach 74 miles per hour to be categorized as a hurricane, and 111 miles per hour to be considered a category 3 major hurricane.

During a hurricane, windows are often exposed to winds that approach (or exceed) their design pressures, but it is critical to know that most windows are designed to withstand 150 percent of their ratings before experiencing any structural or physical damage to their components.  Alternatively, windows are only designed to resist water penetration at 15 percent of their ratings which is commonly exceeded during hurricane categorized storms. If a window leaks during a hurricane, that doesn’t inherently also mean the system has structural damage or has been compromised by the storm. Windows can leak through joints within their system from wind-driven rainfall and not have components permanently damaged or compromise the window.

The progression of damage helps to determine the extent of damage (if any) a window has experienced from hurricane winds. Moisture ingress through windows often occurs first, followed by impact damage from windborne debris, then structural damage begins to occur from direct forces from the wind. It is commonly misunderstood that if windows leak, they are also compromised. In reality, windows can leak without compromising their ongoing performance values or have a permanent impact on the system.

Author

Brandon Bealmear, P.E., Fenestrations Practice Leader, Forensic Engineer

Brandon D. Bealmear, P.E., FMPC, is the Fenestrations Practice Leader and a Forensic Engineering with Haag Engineering Co. Mr. Bealmear is an AAMA Certified Fenestration Master with 17 years’ experience with glass, wood, aluminum, concrete, masonry, and other construction materials. He has designed, consulted, and written quality control and forensic testing protocols for building envelopes, including fenestration systems and wall systems. His design experience includes performance consulting, mock-up evaluation and testing, construction quality control and defect evaluation, and special controlled inspections. Mr. Bealmear has also provided forensic analysis for residential and commercial properties. His experience includes material failure to structural collapse, construction defects, damage assessments from hail, wind (including tornadoes and hurricanes), earthquake, snow loading, and moisture intrusion. Brandon Bealmear– Fenestration Expert Flyer


Any opinions expressed herein are those of the author(s) and do not necessarily reflect those of Haag Technical Services, Haag Engineering Co., Haag Education, or parent company, Haag Global, Inc.
Common Misconceptions in Property Damage Investigations, August 2023

By Amber Prom, P.E., Director of Curriculum, Forensic Engineer

Identifying the cause of property damage can sometimes be a hefty task.  In many cases, damage that appears to have been caused by one thing, upon closer investigation, was caused by something entirely different.  In this installment of “Property Damage Myths & Misconceptions”, we are going to take a look at ‘zippering’ of asphalt composition shingles and dig into exactly what causes this phenomenon.

Wind Zippering

When it comes to asphalt composition shingle roofing, it is difficult to find a property inspector who has not been on an asphalt shingle roof and observed long diagonal or zig-zag runs where the end of each shingle has become detached from the roof surface.  This condition creates a stair-step or zipper-like pattern of partial shingle detachment across the roof surface and is very often labeled as wind-related damage to the roofing.  But is this condition actually caused by wind? Let’s take a deep dive and see if we can figure out just what causes this ‘zippering’ effect.

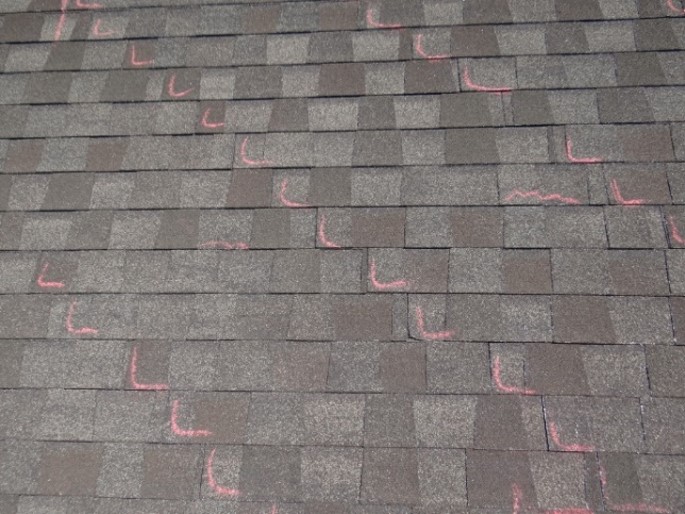
‘Zippering’ is a common condition found on residential roofs with asphalt composition shingles.  In fact, all asphalt shingle roofs will eventually develop some level of ‘zippering’ unless the adhesive is so tenacious, that instead, the shingles develop tears or splits.  The condition consists of diagonal or vertical runs of partially detached shingles that create a stair-step or zipper-like pattern across the roof’s surface, as can be seen in Figures 1 and 2.  When observed on a roof, it is not uncommon for that condition to exist across all of the roof slopes, with the only portion of the shingle that has become detached being the bottom corner of just one end of each shingle.

Figure 1. Diagonal or vertical runs of partially detached shingles that create a stair-step or zipper-like pattern across the roof’s surface
Figure 2.

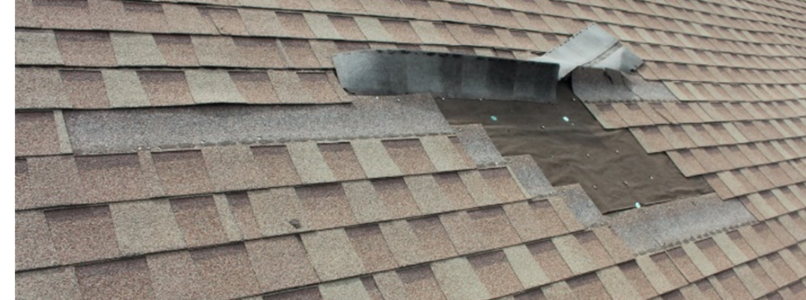
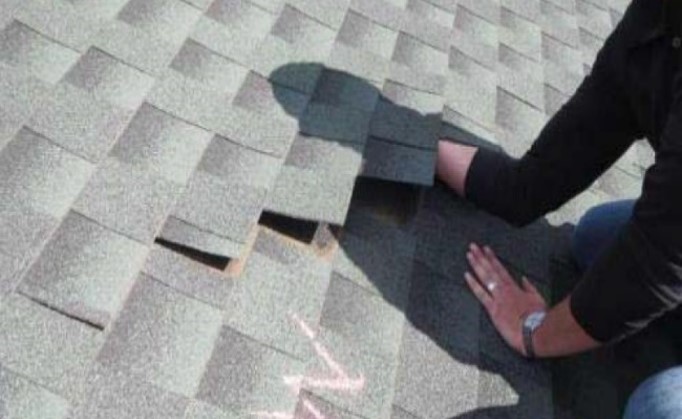
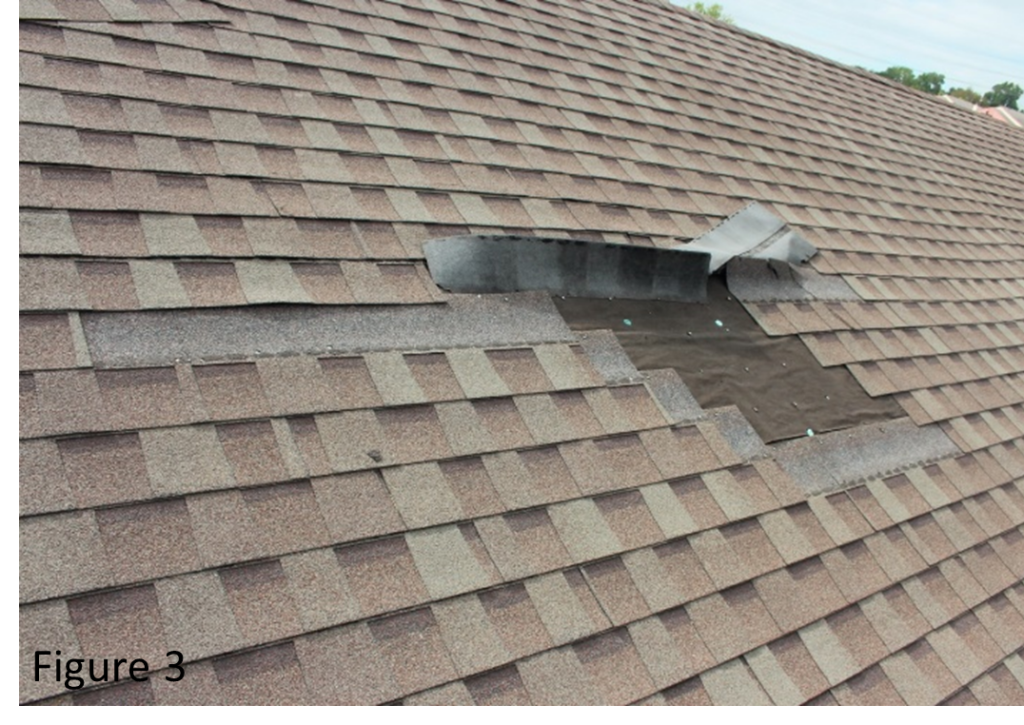
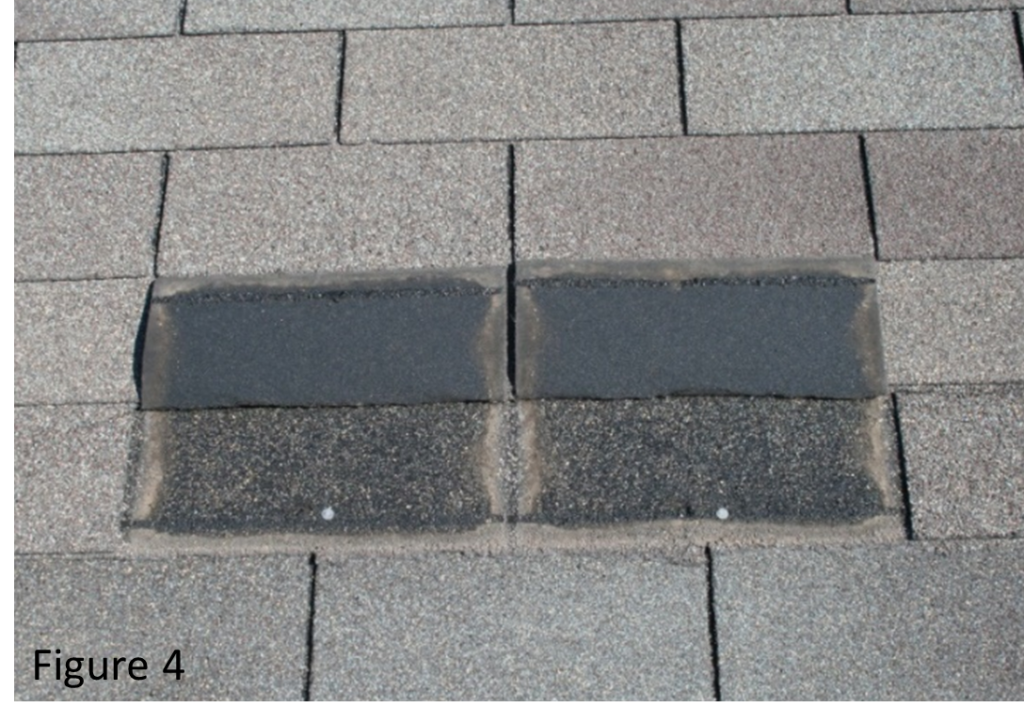
When trying to determine the cause of this patterned condition, many inspector’s minds go straight to wind.  This is no surprise as wind does apply an uplift force on the roof covering, which can detach shingles if the wind is strong enough.  However, when wind is the cause of the shingle detachment, the bottom edge of the shingle suddenly becomes detached at the shingle’s sealant strip due to the wind applying sufficient uplift force to cause sealant failure.  Once the bottom edge detaches, the shingle either lifts and tears out around the nails, or the individual shingle tabs will lift and fold at their first point of restraint, which is the bottom edge of the overlying shingle, very close to where the top of the shingle is nailed down as shown in Figures 3 and 4.

Figure 3.
Figure 4.

In fact, if we think about the way wind acts on a roof, the mere detachment of just the corners of each shingle, with no folding, creasing, or tearing of the shingles, doesn’t really make sense for a number of reasons. 

For one, wind pressures across a roof surface are highest near the perimeters of the roof facets, so near the roof eaves, rakes, hips, and ridges.  Wind pressures gradually decrease and are lowest out in the middle of the field of the roof.  With this in mind, one would expect for wind-related damage to occur where the wind pressures are greatest, not in straight or diagonal lines across the area of the roof that experiences the lowest wind pressures.

Secondly, while the wind pressures across the roof surface will vary, the wind uplift pressures experienced by any given shingle/shingle tab will be relatively uniform and even across that shingle’s exposed surface.  Wind does not pull up on just one particular spot or area of a shingle. As a result, the pulling action of the wind will most often cause uniform detachment of the entire sealant strip, rather than a pulling action that initiates or concentrates at one corner of the shingle, detaching only a small portion of the sealant strip.

And finally, wind force on a shingle does not stop once the sealant strip has failed. Because of this, a detached shingle or shingle tab will lift from the surface of the roof, becoming creased, torn, or completely detached from the roof surface when wind is involved.  If a wind pressure is strong enough to fail the sealant strip, then it is most certainly strong enough to lift a shingle that is no longer sealed down to the roof surface and at minimum crease or tear it. 

The fact of the matter is, when we see this ‘zippering’ of the shingles occur, all we see is mere detachment of just the far end of the shingle, with no creasing, tearing, or displacement, which would be all but impossible if wind was the cause for the sealant failure itself.  In fact, the mere presence of shingles that are detached from the roof’s surface, but do not exhibit creasing, folding, or tearing is a great indicator that the roof has not experienced very high winds because if it had, those shingle tabs that were not attached down to the roof surface would surely have lifted and folded even under lesser wind speeds.  In no scenario will the wind apply an intense pressure, causing detachment of the sealant strip, and then immediately stop at that moment of failure, and gently set that shingle back down uncreased because wind speeds change gradually over several seconds and not instantaneously.

So, if not wind, what is causing this phenomenon? What is causing this specific pattern of localized detachment of the shingles with no associated creasing or tearing? The answer to that question is most often good old cyclic expansion and contraction.  Although it may be hard to see or even visualize, every material expands and contracts under variations in temperature, some materials far more than others.  The wood framing and roof decking also expand and contract with changes in humidity. For this reason, structures are constantly moving and differential movement between building elements has consequences.

In the case of asphalt composition shingles, each shingle is adhered to two adjacent underlying shingles, as shown in Figure 5.

Figure 5.

The overlying pink and purple shingles are attached via their black sealant strip to two underlying green and blue shingles.  As you can see, the joint between the two underlying shingles lies just to the right of the left end of the purple shingle. As the blue and green shingles contract (shrink), they pull away from one another and this causes stresses to build in the purple shingle that is sealed down to both the green and blue shingle.  In many cases, the roofing materials can resist these stresses and nothing happens.  But over time, cyclical stresses in the sealant strip eventually cause the adhesive to unbond.  Due to the shorter length of engagement, the portion of the sealant strip near the left corner (shown in red) will fail, releasing from the green shingle. This mechanism occurs several times each day with temperature changes, cloud cover variations, surface cooling from rain, etc. Nearly every shingle on the roof will eventually have this small segment of adhesive detachment causing a stair-step or zipper like pattern across the roof, which follows the pattern the shingles were installed.

As you can see, in every location where a pink or purple shingle tab is attached down to both a blue and a green shingle, the shorter portion of the sealant strip detaches.  And similarly, in every location where a blue or green shingle tab is attached down to both a pink and purple underlying shingle, the shorter (left) end of the sealant strip detaches, causing a ‘zippering’ pattern across the roof’s surface.

If the shingles were installed in the opposite direction but still in a diagonal fashion, the right end of the shingles would exhibit this detachment, as shown in Figure 6.  And if the shingles were installed in a ‘straight-up’ or ‘racked’ pattern, the detachment will exhibit a zig-zag pattern in a vertical column, as shown in Figure 7. Regardless of the installation method, the end of each shingle that overlaps the joint between two underlying shingles is where the detachment occurs.  And because these are shrinkage stresses at play rather than uplift forces, there is no lifting, folding or creasing of the shingles where they’ve become detached.

Figure 6.
Figure 7.

So, there you go folks – the wind-related zippering of asphalt shingles has been debunked.  The culprit of this phenomenon is not wind, but rather cyclic expansion and contraction.  So, next time you are out on roof, and you observe this ‘zippering’ effect, you will know exactly what is going on.

A few things to note about this condition: While the partial detachment of the shingles is not initially caused by wind, once the detachment occurs, the shingles become more susceptible to becoming wind damaged.  Any portion of a shingle that is no longer sealed down to the roof can be lifted off the roof surface and creased or torn by wind pressures at much lower wind speeds.  An easy solution to prevent this from happening is hand-sealing any locations you find that exhibit detachment at the sealant strip.

If you’d like to learn more about the subject, you can read a more thorough article written by Dr. Carlos Lopez, PhD; Jonathan S. Goode, PhD, PE; and Scott R. Morrison, PE, titled Misconceptions of Wind Damage to Asphalt Composition Shingles.  Or you can enroll in our Haag Certified Inspector- Wind Damage Course and become a Haag Certified Wind Inspector yourself, which can be found at www.HaagEducation.com.

Stay tuned for another case of “Property Damage Myths & Misconceptions” by checking in on the Haag Global Blog or by enrolling to receive our Haag monthly newsletter!

Author

Amber Prom, P.E., Director of curriculum

Amber M. Prom, P.E., is Haag’s Director of Curriculum and is based out of the greater Denver area. Ms. Prom is a Registered Professional Civil/Structural Engineer with 18 years’ experience in structural design, project management, forensic engineering, and engineering management/training. After working in the design field for approximately 8 years, Ms. Prom worked in the field of forensics as a Professional Development Manager and Principal Consultant for approximately 10 years. As a Professional Development Manager, she was responsible for training all newly hired Civil/Structural Engineers and Building Consultants and providing continuing education/training for existing experts.  As a Project Engineer/Principal Consultant, she conducted forensic engineering investigations related to structures which had failed, become damaged, did not operate/function as intended, or were constructed deficiently.  Most of her investigations involved hail damage to structures caused by wind, hail, tornados, hurricanes, and earthquakes, along with fires, explosions, ground vibrations, and construction defects.  Ms. Prom has also been engaged as an expert witness in numerous mediations, arbitrations, depositions, and trials throughout her career.  Currently, Ms. Prom acts as Haag’s Director of Curriculum and develops/manages all of Haag Education’s training curriculum, including the Haag Certified Inspector and Haag Certified Reviewer Programs.


Any opinions expressed herein are those of the author(s) and do not necessarily reflect those of Haag Technical Services, Haag Engineering Co., Haag Education, or parent company, Haag Global, Inc.

Piecing Together the Weather Puzzle – An Introduction to Forensic Meteorology, July 2023

Piecing Together the Weather Puzzle – An Introduction to Forensic Meteorology

By Fred Campagna, CCM, CBM, Senior Forensic Meteorologist

Since 1980 the United States has faced a whopping 357 weather and climate disasters where overall damages/costs exceeded $1 billion. That’s an average of 8.1 per year, and the number is increasing over time. There were 18 events in 2022 that exceeded $1 billion, and the total cost of those events was a staggering $175.2 billion. As of early June 2023, there have already been nine weather/climate disaster events exceeding $1 billion in damages/costs.

With an ever-increasing number of major weather events seemingly exacerbated by climate change, the ability to accurately recreate what the weather conditions were at any given place and time is paramount given the huge number of insurance claims and litigation that ultimately stem from these events. That’s where the science of forensic meteorology plays a critical role in helping show the ground truth at a singular point during a weather event. 

Sifting Through a Vast Archive of Data

Whether it’s a $1 billion dollar disaster or a localized thunderstorm that causes damage to a few structures, there are a bevy of tools at the disposal of a forensic meteorologist to begin piecing together what the weather was like when the storm struck. The United States has over 900 land-based Automated Surface Observing Systems (ASOS) sites operated jointly by the National Weather Service (NWS), Federal Aviation Administration (FAA), and Department of Defense (DOD). In addition, there are approximately 650 similarly reliable Automated Weather Observing System sites operated by state or local governments and other non-federal entities. While 1500+ stations may seem like enough to blanket our country, there can be sizeable distances between these stations, and the weather that happens at an ASOS/AWOS station may not reflect what the weather was just a mile or two away. Thankfully, those stations are just one tool in the toolbox of a forensic meteorologist.

The National Centers for Environmental Information (NCEI) keeps a record of quality-controlled severe weather data from across the country. The Storm Events Database contains reports from NWS surface instruments; eyewitness reports by trained storm spotters or emergency management officials; media and social media reports; and occasionally, the reports of observations teams dispatched by the NWS. This searchable database can provide a few more clues to a forensic meteorologist, and the picture may come into slightly better focus, but it’s still not sharp enough.

The United States also contains a dense network of weather radar scanning the skies every 1-5 minutes to help determine precipitation rate, precipitation type, wind speed/direction, and more. There are more than 200 combined Next Generation Weather Radar (NEXRAD) and Terminal Doppler Weather Radars (TDWR) to help fill in the gaps between in-situ observations from ASOS/AWOS stations and the reports in the Storm Events Database. A forensic meteorologist uses data from these advanced radar systems to drill down even farther into exactly what was happening at any street corner in the country at a specific minute of any day for the past decade or more.


While land-based observations, the Storm Events Database, and weather radar are three important sources of weather data, they are not the only three that can be useful for a skilled forensic meteorologist. A thorough analysis may also include retrieving data from other sources including local storm reports through volunteer organizations (CoCoRaHS); news reports; archived National Weather Service forecasts, warnings, and advisories; archived computer model data; and other climate monitoring products available from NCEI for snow, ice, flood, drought and more. 

Certified Consulting Meteorologists – A Standard of Excellence

The puzzle pieces are many, and when it comes to putting them all together in a scientifically sound and succinct report, a Certified Consulting Meteorologist (CCM) is the best person for the job. The American Meteorological Society has awarded fewer than 800 CCM designations since 1957, and only about 250 are considered active in the field. A CCM candidate needs not only the requisite education and at least 5 years’ professional experience, but also must complete a rigorous application and testing process requiring multiple letters of reference, a written exam with 90 days to complete, a consulting essay, and finally an oral examination in front of the CCM board. Professional development activities are necessary to maintain an active CCM distinction. Haag Global, Inc. is proud to have three active Certified Consulting Meteorologists on our team, so you can rest assured that your assignment will be handled with the utmost professionalism, expertise, and highest ethical standards. 

Author

Fred Campagna
Fred Campagna, CCM, CBM, Senior Forensic Meteorologist

Fred Campagna is a Senior Forensic Meteorologist with Haag Global. He is a veteran on-air meteorologist with 25 years’ experience in Atlanta, Boston, and throughout the Northeast. Fred has worked as forensic and consulting meteorologist for 11 years. He is President and Chief Meteorologist at Right Weather LLC, where he provides private forecasts for weather-dependent businesses and municipalities, consulting meteorology for civil and insurance-related legal cases, and courtroom and deposition testimony.

Fred’s certifications include American Meteorological Society’s Certified Consulting Meteorologist designation, September 2020, and American Meteorological Society’s Certified Broadcast Meteorologist designation in March 2006. He was awarded American Meteorological Society’s Television Seal of Approval, among numerous other honors and awards. He holds a Bachelor of Science degree (cum laude) in Meteorology from Plymouth State University, Plymouth, New Hampshire, where he also served as Vice President, Plymouth State College Chapter of American Meteorological Society. He also earned a Bachelor of Arts degree in Economics (Business Emphasis) from the University of Colorado, Boulder. He is a member of the American Meteorological Society and the Association of Certified Meteorologists (Consulting Member).


Any opinions expressed herein are those of the author(s) and do not necessarily reflect those of Haag Technical Services, Haag Engineering Co., Haag Education, or parent company, Haag Global, Inc.
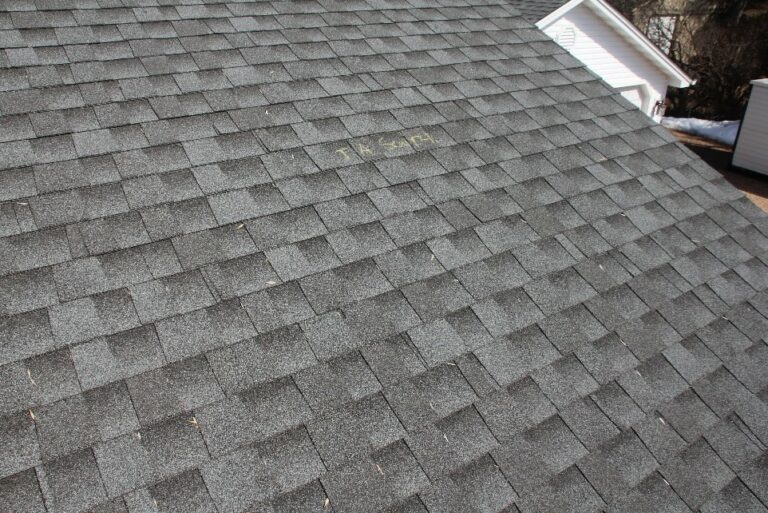
Solar Panel Testing – June 2023

Solar panel testing 

Solar power generation has gained popularity in recent years. These days, solar panels seem to be everywhere. According to the Energy Information Administration, U.S. developers plan to add 54.5 gigawatts (GW) of new electric generating capacity in 2023, with more than half being powered by solar energy.1

We see solar panels attached to residential and commercial roofs, road signs, electric vehicle charging stations, billboards, weather stations, pump houses, and of course, large arrays at solar farms. Sometimes solar panels are small and provide electrical energy to power a single component, whereas solar farms can have 1,000s of panels mounted together to supply power to our electric grid. One thing all solar panels have in common…they can be struck by hail. 

The panels above were impacted by hailstones measuring about two inches in diameter; about 10% of the panels were damaged.

With all the solar power in use today, and with an increasing number of solar panels in hot sunny climates such as the southwestern United States, it is inevitable that more solar panels are going to be struck by hail each year. There has been an enormous amount of research into the minimum size of hail able to damage roof coverings, but information on hail-caused damage to solar panels is somewhat limited.

Haag Research & Testing (HRT) is working to change that. HRT is constantly looking for testing protocols that can add to our forensic testing ability and the knowledgebase of our industry. The Haag laboratory has recently added several test methods to our list of accredited test standards. Two of these test standards address hail impact performance of solar panels. HRT is now accredited to perform Factory Mutual (FM) 4478 – Appendix E, and IEC 61215-2 (MQT 17). Both of these standards are followed to provide impact ratings for solar panels and the procedures can be adapted for forensic use to determine what minimum size of hail can damage solar panels.

Haag engineers can inspect solar panels for hail-caused damage and offer opinions regarding the extent of damage and repairability concerns. Our laboratory can perform simulated hail impact testing on solar panels either removed from an inspected property or new panels acquired from distributors. Our unique ability not only to perform post hail inspections, but also perform simulated hail impact testing is what sets Haag apart from others in our industry, not only for roofing damage assessment, but for damage assessment of other items, including building components, cladding, vehicles, and yes, even solar panels.   

Questions about solar panel testing or solar panel damage assessment? Please contact Haag here or call us at 800-527-0168 with questions.

1.       “Solar to dominate new U.S. electric-generating capacity in 2023, EIA says”. Harshit Verma and Brijesh Patel, Feb. 6, 2023. https://www.reuters.com/business/sustainable-business/solar-dominate-new-us-electric-generating-capacity-2023-eia-says-2023-02-06/

Author

Steve Smith, P.E., Director of Research & Testing, Principal Engineer

Steven R. Smith is a Forensic Engineer with Haag Engineering Co., and the Director of Research & Testing. Mr. Smith is an experienced forensic engineer who began his career with Haag more than 24 years ago. He spent seven years working as a Senior Lab Technician while earning a Bachelor of Science in Mechanical Engineering degree from The University of Texas at Arlington. He has been involved with the lab throughout his career, and has been able to leverage his extensive and practical engineering field experience with research and testing projects.

Mr. Smith’s areas of expertise include accident reconstruction, mechanical equipment evaluations, code and standards compliance, roofing system evaluations, and fires and explosions. He is a licensed Professional Engineer in Arkansas, Minnesota, Missouri, Oklahoma, Texas, and Wisconsin. He is a member of the American Society of Mechanical Engineers (ASME), Society of Automotive Engineers (SAE), and Pi Tau Sigma National Honor Society. Prior to joining Haag, Mr. Smith was a Petty Officer Second Class in the United States Navy. He trained at the Navy Nuclear Power Training Command Center in Orlando Florida and was stationed on the USS Arkansas (CGN-41), where he maintained reactor and steam plant chemistry, performed radiological controls, and operated mechanical equipment in the propulsion plant.


Any opinions expressed herein are those of the author(s) and do not necessarily reflect those of Haag Technical Services, Haag Engineering Co., Haag Education, or parent company, Haag Global, Inc.

Geographic Information Systems (GIS) in Facility Management – May 2023

Haag provides a range of technical support, resources, and analyses to assist clients in the forensic, insurance, oil & gas, and architecture, engineering, and construction sectors. Services include Matterport 3D visualizations, Geographic Information System (GIS), laser scanning, small unmanned aerial systems, and more. Geographic Information System (GIS) is a powerful tool that allows companies to combine large amounts of data from different sources, order them into layers, and visualize the relationships between the datasets. GIS’ has a wide range of applications, including facilities management. 

Geographic Information Systems (GIS) in Facility Management

By Matthew Young, GIS Analyst

What is Facility Management?

Facility Management (FM) involves monitoring all facets of the day-to-day operations for an organization’s physical environment. This includes the tools and services that support the functionality, safety, and sustainability of buildings, grounds, infrastructure, and real estate. The assets could include multiple buildings across a college campus, a factory that builds cars, a commercial property that contains multiple businesses, or a downtown skyscraper that consists of multiple floors to name a few. According to Fortune Business Insights, the global facility management market size was $1,260,000,000 in 2022, and is expected to grow to $1,846,000,00 by 2029–a staggering 5.7%. Due to this tremendous increase in capital, facility management processes and plans are going to be at the forefront of these increasing demands.

GIS Role in Facility Management

Facility Management staff need have real-time data at their fingertips, whether on desktop or mobile devices. Multiple software applications exist for this but are typically limited to the interiors of structures. Geographic Information Systems (GIS) fills this need by providing real-time map-based data helping meet the demands of facilities managers and their teams. Field software like ESRI’s ArcGIS Survey123 or ArcGIS Field Maps can help facility management teams collect and organize data using a simple form driven by mobile technology in the field. These applications allow workers to capture and edit data, find pivotal asset information, report critical issues, and monitor equipment and operations from their mobile or desktop devices. Managers now have access to critical, real-time information and can easily make data-driven decisions.

Haag Facility Management Geoportal

Haag developed its Facility Management Geoportal (FM Geoportal) to meet the need of facilities managers. Haag’s FM Geoportal utilizes location-based data to assist in  guiding operations with GIS workflows and streamlined tools for data collection and management. Haag used both desktop and mobile data collection apps to help a local church map all the AC units on its campus and collect attributes associated with each AC unit and its location. Using Survey123 on a smartphone app, members of the church’s facilities department collected the AC unit locations and completed a simple form with relevant information about each unit such as overall condition, freon type, model number, serial number, and more. The collected units immediately appeared on the FM Geoportal map symbolized as red points to indicate that they needed to be reviewed. Once the facilities manager had reviewed a unit’s attributes, he updated the status to “reviewed” via the FM Geoportal editing tool which changed the point color to green. This workflow made it easy for the entire facilities department to collaborate and efficiently collect, visualize, and update information in real time.

Now that the data has been collected, multiple users have access to the information in a map-based platform which helps the team determine which AC units need to be budgeted for repair or replacement in the coming year. This same process could be used in the future to map out a sprinkler system by collecting valves and sprinkler head locations, then connecting the sprinkler heads with lines. Knowing where the lines are located would help prevent any line strikes during future construction projects.

GIS Based Client Customized Facilities Management

Organizations rely upon their facilities management tools to ensure that their day-to-day operations remain intact. Using GIS and collection software like Survey123 or ArcGIS Field Maps provides users with an efficient, scalable, and easy-to-use platform that allows stakeholders to monitor key assets. The Haag FM Geoportal is a powerful, user-friendly tool that gives users agency over their own data with accessibility and reliability at the forefront. It is also customizable to user needs and can grow with them. If you would like to learn more, please contact Matthew Young for more information. 

Author

Matthew Young, GIS Analyst
Matthew Young is a GIS Analyst with Haag Global, Inc. Mr. Young joined Haag more than six years ago as a GIS Technician. He specializes in overseeing GIS data collection and analysis. He has worked with the oil & gas industry, validating pipeline/well data collected by surveyors in order to place information into a geodatabase. The validation process includes quality control of spatial components of the data to ensuring there are no gaps, multi-parts, self-intersecting lines, etc..  He analyzes surrounding data used to make sure the deliverable data matches up with the SDE and PODS data. He utilizes tools such as Python and FME to help with these processes. He has assisted in the development of software including the Haag Facility Management Geoportal. For more information on facility management or Haag’s Geoportal, please contact Matthew Young. 


Any opinions expressed herein are those of the author(s) and do not necessarily reflect those of Haag Technical Services, Haag Engineering Co., Haag Education, or parent company, Haag Global, Inc.

When Arson is an Inside Job- April 2023

WHEN ARSON IS AN INSIDE JOB

By Robert Shotwell, NAFI-CFEI, Fire Consultant

Haag Fire Investigations specializes in fires and explosions of any scope, from automobiles to large commercial complexes, single- and multi-family housing, manufacturing facilities, marine fire investigations, arson investigations, and heavy equipment. Our team is committed to quickly finding the answers you need through industry-recognized scientific methods and standards. The case detailed below is one of the most intriguing arson cases in recent history. 

John Leonard Orr, also known as the “pillow pyro”, gained notoriety after he was convicted in 2002 for intentionally setting approximately 2,000 fires, which resulted in millions of dollars in damage and the tragic deaths of 4 people.  Orr was a fire Captain and arson investigator for the Glendale Fire Department in Southern California.  He originally wanted to be a police officer, however, he could not pass the entrance exams and became a firefighter.  [1] 

There have been multiple psychological studies conducted to determine why someone becomes an arsonist.  However, many pre-screening psychological evaluations are lacking as it relates to determine if the firefighter candidate will become a firefighter arsonist.  If the pre-screening psychological evaluations included previous behaviors that could be linked to pyromania and was tailored specifically for firefighter candidates, it would better determine the likelihood that the firefighter candidate would become or is an arsonist.

Pyromania is associated with an individual who has multiple episodes of deliberately setting fires.  People who intentionally set fires do so for several reasons, including: releasing tension, fascination with fire, pleasure, and gratification  Research has discovered that a lot of time and mental preparation is involved for a pyromaniac to start a fire.[2]

The proliferation of incendiary fires set by firefighters has forced firefighting agencies across the world to develop strategies and polices to try and stop this upward trend.  Because fire departments do not conduct a comprehensive psychological evaluation during the hiring process, they fail to eliminate candidates that have the propensity to be or become an arsonist.  These failures can cause unnecessary embarrassment, injury, financial loss, and even death.[3]

The fire service is shedding light on the fact that some firefighters are arsonists.  A small percentage of otherwise trustworthy firefighters are causing the fires they extinguish.  The total amount of illegal fire setting throughout the nation’s fire personnel is unknown, as there has been little research conducted specifically on arson, and there is even less information on arsonists who are also firefighters.[4] 

The impact of firefighter arson can be severe.  People die or are seriously injured, including fellow firefighters, who respond to the call.  An arsonist from within the fire department can disgrace the whole department, and his actions can diminish public trust.  There are several states throughout the country that have enacted new legislation that specifically addresses firefighters that are prosecuted for arson.  Throughout the United States, many jurisdictions have enacted firefighter arson task forces.  These task forces focus on training, education, and how to conduct appropriate background checks.[5]

In the 1990’s, the National Center for the Analysis of Violent Crime (NCVAC) conducted research and developed “tell-tale” signs that a firefighter might be intentionally setting fires.  One of the “tell-tale” signs included a large increase of fires within that fire department’s area of operation.  It was also suggested that the firefighter arsonist would have been working with the fire department for less than three years.  NCVAC conducted research on 25 cases of arson fires that were started by firefighters.  The results of this research “showed that the number one motive was excitement, especially among young firefighters who were eager to put their training to practical use, and to be seen as heroes to fellow firefighters and the community they served.  In that study, 75 firefighters were found to have been responsible for 182 fires.[6]

The NCVAC report also revealed that, generally, the firefighter arsonist would start with a small fire, described as a nuisance fire.  A nuisance fire would include a trash pile, vegetation, or a dumpster fire.  The firefighter arsonist would then advance to more serious fire-setting that would involve vehicles or unoccupied buildings[7].  The results of research on firefighter arsonists have aided in developing a profile and methodologies as to why a firefighter would deliberately set fires.  The first reason, is the desire of a firefighter to be respected by their peers.  The firefighter, in order to show how proficient they are in their trade, will attempt to prove this by setting a fire.  Many of these fires are set by firefighters who are white males in their early twenties.[8]

The second reason a firefighter would deliberately set a fire can be caused by boredom at the firehouse.  This is due to the long periods of no activity, especially at a fire station that does not have a large call volume.  The third reason and more problematic reason is due to vanity which is also classified as a hero complex.  The hero complex is the result of a firefighter wanting attention or praise for the job they do.  The hero complex should not be confused with the atta-boy complex.  The atta-boy complex is described as a firefighter who wants praise from his peers and not from outsiders.[9]

The information presented provides current and future researchers with data to help in determining if a firefighter candidate has the proclivity to become a fire setter.  It is important that the practitioners, who are performing the psychological assessments of future firefighters, have this data as it can assist them with their diagnosis and ability to decide if they potentially could become an arsonist or not.  After an extensive investigation, Captain Orr was arrested December 4, 1991, and convicted on July 31, 2002, He is currently serving a life sentence in the California prison system.  Many investigators believe that Orr is the worst American serial arsonist to date.

_____________________________

[1] https://murderpedia.org/male.O/o/orr-john-leonard.htm (March 23, 2023).

[2] American Psychiatric Association. (2000). Diagnostic and statistical manual of mental disorders (4th ed., text rev.).

[3] Hinds-Aldrich, M. (2011). Firesetting Firefighters: Reconsidering a Persistent Problem. International Fire Service Journal of Leadership And Management, 5, 33-46.

[4] Hinds-Aldrich, M. (2011). Firesetting Firefighters: Reconsidering a Persistent Problem. International Fire Service Journal of Leadership And Management, 5, 33-46.

[5] Stambaugh, H., & Styron, H. (2011) U.S. Fire Administration.  https://www.usfa.fema.gov/downloads/pdf/publications/tr-141.pdf

[6] Stambaugh, H., & Styron, H. (2011) U.S. Fire Administration.  https://www.usfa.fema.gov/downloads/pdf/publications/tr-141.pdf

[7] Stambaugh, H., & Styron, H. (2011) U.S. Fire Administration.  https://www.usfa.fema.gov/downloads/pdf/publications/tr-141.pdf

[8] Hinds-Aldrich, M., Duggan, D., et al.  Firefighter Arson. National Volunteer Fire Council. https://www.nvfc.org/firefighter-arson/.

[9] Hinds-Aldrich, M. (2011). Firesetting Firefighters: Reconsidering a Persistent Problem. International Fire Service Journal of Leadership And Management, 5, 33-46.

Author

Robert Shotwell, NAFI-CFEI, fire consultant

Robert Shotwell is a Fire Consultant with Haag Global. He has a total of more than twenty years of forensic experience in a wide range of industries, including the U.S. Navy Reserves, U.S. Coast Guard Reserves, as a Special Agent for the Florida Department of Law Enforcement, and as a Law Enforcement Officer for various municipalities. His forensic experience includes investigations of fire and explosion incidents in vessels and commercial, industrial, and residential structures, as well as electrical and mechanical systems. Mr. Shotwell has also conducted extensive criminal investigations involving missing persons, homicides, human trafficking, fraud, identity theft, and public corruption. Robert is a Chief Petty Officer in the Coast Guard Reserves. and is a certified fire and explosion investigator.

  • 20+ years of investigative training and experience
  • Court tested and reliable. Experienced in municipal, civil & criminal trials
  • Specialty in Vessel Fires
  • Investigated multi-million-dollar fire losses


Any opinions expressed herein are those of the author(s) and do not necessarily reflect those of Haag Technical Services, Haag Engineering Co., Haag Education, or parent company, Haag Global, Inc.
Diagnosing Cracks in Common Construction Materials – March 2023

Diagnosing Cracks in Common Construction Materials

By Amber Prom, P.E., Director of Curriculum

Identifying damage, especially when that damage has been pointed out to you, is not rocket science.  Determining what caused that condition and whether that condition is a concern is a whole other story.  Many times, we find ourselves out on site looking at a crack in a material and wondering, what on earth might have caused this?  Has the crack been there for some time, or did it develop recently? Is this crack even a concern?  While determining the cause and severity of a crack can be somewhat difficult, arming ourselves with information regarding the most common mechanisms that cause cracks to form in our most predominant building materials can help us narrow down the possibilities.

Common Crack Mechanisms in Drywall

While unsightly, drywall cracks are typically harmless.  Drywall is not commonly used as a structural material, so there is little worry that any sort of structural harm has been caused by a drywall crack.  Drywall is not part of the exterior building envelope, so there is little concern that the crack will let in moisture/weather. However, drywall cracks can be an indicator of a larger problem. Two of the most common causes for drywall cracks are:

  1. Expansion/contraction of the framing members upon which the drywall is attached (not such a tragic thing) and
  2. Localized foundation movement ( can be a major issue).

Expansion/contraction is a common phenomenon in wood particularly. Wood is a hygroscopic material, meaning it has a tendency to absorb moisture from the air. When this happens, wood will expand in size. Drywall, on the other hand, does not expand/contract at the same rate as wood, nor is it as flexible a material.  This means when the two materials are connected and the wood changes size, the drywall cracks. Most commonly these cracks will show up where the drywall is weakest, which is at the joints between drywall panels. As such, this results in very linear cracks that propagate either vertically or horizontally (See the upper-right image).

What we need to watch out for though, are cracks that are a result of foundation movement, as that is a larger problem that can cause far more damage than just cracks to finishes. Drywall cracks that are the result of localized foundation movement very commonly propagate either vertically or diagonally from the corners of doors and windows (see the lower-right image), and the cracks are typically concentrated in the area of localized foundation movement, which will need to be verified by a forensic expert. Other indicators of foundation movement are windows and doors that no longer open/close correctly and floor surfaces that do not feel level. 

Cracks in concrete

Common Crack Mechanisms in Concrete

Even more common than cracks in drywall are cracks in concrete. Concrete is a brittle material known to perform well in compression but poorly in tension. For this reason, we reinforce concrete with steel rebar to give the concrete member better tensile strength, but regardless, it is exceedingly difficult to altogether prevent concrete from cracking.

The most common cracks you will typically see in concrete are shrinkage cracks.  These cracks form when the concrete cures, losing its water content and consequently shrinking in size.  This shrinking can cause multi-directional cracks to form in the surface of the concrete, especially if the concrete cures too quickly or cures unevenly. Shrinkage cracks do not typically penetrate the full thickness of the concrete. Instead, they tend to meander in various directions across the exposed surface of the concrete and occur in higher concentrations near the perimeter edges and corners of the concrete member.

Other common mechanisms that can cause concrete to crack include, but are not limited to:

  • Issues with post-tensioning practices
  • Slab geometry issues
  • Differential expansion/contraction stresses
  • Differential movement of supporting soils
  • Overstressing
  • Impact damage

Old vs New Cracks

In addition to working to determine the cause of a crack, we are sometimes faced with determining when a crack developed. Is the cracking something that occurred recently, or did this crack develop sometime in the past? Characteristics that can assist in determining whether a crack is new or old are:

  • Newly developed cracks are well-defined, with sharp edges and a clean fracture surface.
  • Newly exposed crack surfaces are commonly brighter in color than the surrounding material.
  • Older cracks typically exhibit weathered/rounded edges, and their fracture surfaces are often stained, or grime covered.
  • New cracks often contain bits and pieces of the fractured material in and around the crack.
  • Older cracks often contain debris, grime, algae, cobwebs, paint, sealant, etc., within their confines.

Regardless of the situation, analyzing the cause, severity, and age of cracks can be difficult and arming yourself with as much information about the common mechanisms that can cause these cracks will only make things easier on you.  If you find yourself wanting to learn more, Haag Education offers an online course titled “Identifying Distress vs Sudden Damage in Construction Materials.” This course will walk the learner through many of the common reasons our most predominant building materials, like concrete, masonry, drywall, and wood, tend to crack or show distress. The course goes further and covers common causes for nail pops, brick veneer detachment, and various moisture conditions.  This course is also part of Haag’s new Haag Certified Reviewer Program (HCR). To register for this course as a standalone, or for more information on the HCR Program, visit www.HaagEducation.com.

Author

Amber M. Prom, P.E., Director of Curriculum

Amber M. Prom, P.E., is Haag’s Director of Curriculum and is based out of the greater Denver area. Ms. Prom is a Registered Professional Civil/Structural Engineer with 18 years’ experience in structural design, project management, forensic engineering, and engineering management/training. Ms. Prom previously worked in the field of forensics as a Professional Development Manager and Principal Consultant for approximately 10 years. As a Professional Development Manager, she was responsible for training all newly hired Civil/Structural Engineers and Building Consultants and providing continuing education/training for existing experts.  As a Project Engineer/Principal Consultant, she conducted forensic engineering investigations related to structures which had failed, become damaged, did not operate/function as intended, or were constructed deficiently.  Most of her investigations involved hail damage to structures caused by wind, hail, tornados, hurricanes, and earthquakes, along with fires, explosions, ground vibrations, and construction defects.  Ms. Prom has also been engaged as an expert witness in numerous mediations, arbitrations, depositions, and trials throughout her career.  Currently, Ms. Prom acts as Haag’s Director of Curriculum and develops/manages all of Haag Education’s training curriculum, including the Haag Certified Inspector and Haag Certified Reviewer Programs.


Any opinions expressed herein are those of the author(s) and do not necessarily reflect those of Haag Technical Services, Haag Engineering Co., Haag Education, or parent company, Haag Global, Inc.