by Aaron Duba, P.E., and Adam Coon, P.E.
A declaratory statement from the Florida Building Commission and recent changes in legislation (Senate Bill 4 (SB4)) have changed one of the most common discussions in the forensic and roofing industry in Florida. Given the frequency of hurricanes and resulting catastrophe work in Florida, changes to the rule are of interest to any industry professional who may work in the state.
The “25 percent rule” had been interpreted as, if you were replacing/recovering more than 25% of a roof section (as defined by Florida Building Code (FBC)), the entire roof would require replacement and must be brought up to the current code, regardless of when it was constructed. Refer to the provision below from the Florida Building Code, Existing Building (FEBC):
- 706.1.1 : Not more than 25 percent of the total roof area or roof section of any existing building or structure shall be repaired, replaced or recovered in any 12-month period unless the entire existing roofing system or roof section is replaced to conform to requirements of this code.
On May 26, 2022, Governor Ron DeSantis signed Senate Bill 4 (SB4). While Senate Bill 4 primarily deals with condominium building inspections and safety, there is a portion of the bill that modifies the 25 percent rule. Section 553.844 of the Florida Statues addresses windstorm loss mitigation and requirements for roof and opening protection. SB4 adds the following verbiage to these statues:
-
(5) Notwithstanding any provision in the Florida Building Code to the contrary, if an existing roofing system or roof section was built, repaired, or replaced in compliance with the requirements of the 2007 Florida Building Code, or any subsequent editions of the Florida Building Code, and 25 percent or more of such roofing system or roof section is being repaired, replaced, or recovered, only the repaired, replaced, or recovered portion is required to be constructed in accordance with the Florida Building Code in effect, as applicable The Florida Building Commission shall adopt this exception by rule and incorporate it in the Florida Building Code. Notwithstanding s. 553.73(4), a local government may not adopt by ordinance an administrative or technical amendment to this exception. …
This states that if the roof in question is in compliance with the requirements of the 2007 Florida Building Code (or newer) it can be repaired no matter the extent of the roof section that is being recovered/replaced and a roof replacement is not required.
Is a roof eligible for this change?
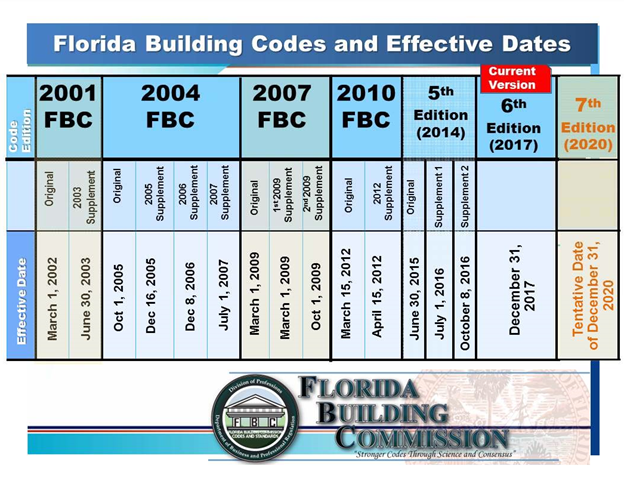
“If an existing roof system or roof section was built, repaired, or replaced in compliance with the requirements of the 2007 Florida Building Code”. The simplest way to determine if the roof meets this requirement is to review the date the permit was issued. The 2007 FBC came into effect March 1, 2009, as noted by the Florida Building Commission in the figure below. One can assume anything permitted after the “original” effective date will be compliant with that code. Therefore, anything permitted after March 1, 2009, was likely built, repaired, or replaced in accordance with the 2007 FBC as indicated by SB4. Refer to the adjacent image for the FBC effective dates courtesy of the Florida Building Commission website.
Can a roof be permitted earlier than March 1, 2009, and comply with the 2007 FBC?
Yes, but it is highly unlikely, and difficult to check. Building codes are the minimum requirements; therefore, buildings could have been built with more wind resistance if requested. After Hurricane Andrew in 1992 and the 2004 and 2005 hurricane seasons (Charley, Frances, Ivan, Jeanne, Katrina, Rita, Wilma, etc.), the Florida Building Commission continued to develop structural and roofing standards that would further increase building resistance to hurricane force winds. Throughout the years following these hurricanes, the FBC changed, among other things, the requirements for attaching a roof deck, a secondary water barrier, and the method of attachment for hip and ridge cap tiles. The numerous changes to the most common roofing types make it unlikely that any roof built before the 2007 FBC effective date meet the requirements of the 2007 FBC.
If your roof was permitted after March 1, 2009, SB4 allows homeowners (and insurance companies) to replace/repair more than 25% of their roof area without having to bring the entire roof up to code (i.e., replace the entire roof). However, concerns remain for contractors and professionals such as designing and installing an adequate “tie-in” transition between the existing roofing materials and the repair area(s), assessing the reparability of roofs (see other article from Haag https://haagglobal.com/june-2018-blog/), and assessing the cost effectiveness of repairs. Further, bias may aggravate disagreements between parties regarding the extent of storm damage, total area of repair required, and cost to repair. Thus, it remains important to have knowledgeable adjusters, engineers, consultants, and roofing contractors assess roof damage.
It should also be noted that SB4 prohibits local governments from adopting amendments to this exception; therefore, no counties in Florida will have exceptions including the High Velocity Hurricane Zone (HVHZ).
If a roof was permitted before March 1, 2009, it remains governed by the 25% rule.
If the roof was permitted before March 1, 2009, it remains governed by the 25% rule. Discussions often arise when quantifying the repair, in regard to the FEBC. Do we only include the components that require repair, or do we include surrounding components (for proper tie-off)? The release of the 2020 FBC removed the “related work” provision, which was often interpreted to limit the extent of the repair area as it related to the 25% provision. As a result, the Florida Building Commission released (April 2021) a declaration (DS 2021-007) which stated “… related work which involves the removal and installation of components for the purpose of connecting repaired areas to unrepaired areas (roof areas required for a proper tie-off) shall not be considered part of the roof repair in question, and therefore such related work shall not be counted toward the 25 percent threshold stated in section 706.1.1…” This statement has provided clarity on a contentious discussion that has affected Florida inspectors for years. Essentially, only the amount of materials needing repair (damaged in most discussions) should be included. This is also discussed by the Florida Roofing and Sheet Metal Association (FRSA) here.
Summary
The Florida Building Commission and SB4 have provided much clarity to a contentious issue that has been ongoing in the roofing industry for years. These recent changes allow homeowners and insurance companies to repair any percentage of a roof, as long as that roof was permitted after March 1, 2009. If the roof was permitted prior to March 1, 2009, only the components that require repair/replacement (generally, the damaged components) are to be included in the 25% calculation.

Aaron Duba graduated from the University of South Florida with a Bachelor of Science degree in Civil and Environmental Engineering. He is a Senior Engineer at Haag Engineering Co. in Tampa, Florida, and is a licensed Professional Civil Engineer in Florida. Mr. Duba is currently a member of the American Society of Civil Engineers and is a licensed drone pilot. Mr. Duba has been with Haag Engineering since 2010, and has inspected and assessed damage to hundreds of roofs and structures. His primary areas of consulting are structural evaluations, roofing system evaluations, general civil engineering evaluations, moisture source evaluations, and flooring evaluations. Mr. Duba helps develop and present continuing education seminars as an instructor for Haag. Prior to Haag, Mr. Duba was in the United States Navy, where he operated and maintained a naval ship and obtained a degree in Marine Engineering.

ADAM COON. P.E., ASSOCIATE ENGINEER
Adam Coon, P.E., is an engineer with Haag Engineering Co. He has 10+ years of engineering experience, including four years as a forensic engineering. He previously worked as a design engineer, reviewing plans, consulting on building envelope designs, and inspecting structures for serviceability and waterproofing. Based in West Palm Beach, Florida, his primary areas of consulting include structural evaluations, general civil engineering, and wind engineering and related storm effects. Mr. Coon earned a Bachelor of Science in Civil Engineering from Florida Atlantic University.
Any opinions expressed herein are those of the author(s) and do not necessarily reflect those of Haag Global, Inc., Haag Engineering Co., or any Haag companies.