Category: Articles

January 2016 Blog Post

VALUABLE CLUES: WHAT TO LOOK FOR DURING COMMERCIAL ROOF INSPECTIONS 


by Ken Gilvary, M.S., P.E., Haag Principal Engineer, 01/2016

Commercial roofing is one of the most demanding areas for expertise in the insurance industry today, as there are millions of commercial structures and hundreds of different roofing systems and variations in application.  Further, the history of a building’s roof may have a significant influence on its performance.  There may be multiple layers of roofing on a single building which include different materials and installation.  Turning back the layers of roofing can reveal historic clues to help us in our evaluations, similar to turning the pages of a good mystery novel.  Use the following tips to aid you in resolving roofing mysteries and reaching accurate conclusions.

The three most common types of low-slope commercial roofing systems are built-up roofing, modified bitumen roofing, and single-ply roofing.  Built-up roofing comprises multiple layers of felt sandwiched together with molten asphalt, which are typically covered with a protective coating, gravel ballast, or a roll-roofing cap-sheet.  These built-up systems offer redundancy due to their multiple layers of reinforcements.  Modified bitumen roofing systems normally comprise a felt base sheet covered with one or two plies of modified bitumen membrane.  The modified bitumen membrane comprises reinforcement coated with asphalt and mixed with a plastic or rubber to make the bitumen substantially tougher and resistant to tearing.  The modified bitumen also needs to be covered with a protective coating such as aluminum-rich paint or granules to protect it from sun exposure.  Single-ply roof systems comprise a variety of plastics and rubbers, including ethylene propylene diene monomer (EPDM), thermoplastic olefin/polyolefin (TPO), and polyvinyl chloride (PVC).  These systems are single-layer applications of roofing sheets that are bonded along their seams with heat or adhesive.  They rely directly on the strength of these seam bonds to keep water from infiltrating the building.  Single-ply systems are designed for direct exposure to sunlight.  When evaluating a roof system, it is important to determine the constituents and attachment of the system, as this information can provide clues as to how the roofing will respond to storm events such as wind and/or hail.


With respect to hail, we should consider that hail storms typically have a predominant fall direction.  This direction can be determined by the examination of building features both on and off the roof.  Hailstone impacts can leave distinct spatter marks on oxidized surfaces such as electric junction boxes, and they often leave permanent evidence of impacts as dents in metals (such as air-conditioner cooling fins, roof vents, and flashing).  Roofing surfaces exposed to the predominant direction of hail-fall will experience the most severe impact, and these areas should be the first to exhibit damage, if any occurs.  Likewise, if damage occurs, it is expected to be more frequent and more severe on surfaces facing the predominant hail-fall direction.

It should also be noted that roofing systems installed over softer substrates (such as foam insulation boards) are more susceptible to hail strikes than those installed over stiffer substrates (such as plywood, concrete, or gypsum cover boards).  This is due to the deflection that can occur in these substances.  Further, areas of ponded water can accelerate the deterioration of roofing membranes and can make these areas more susceptible to impact.

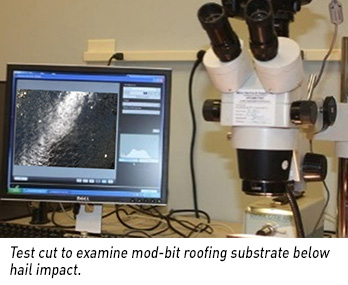
Evaluation of large hail strikes against built-up and modified bitumen roof systems often requires the removal of roofing cores, which are transported to the lab for further examination. Removal of roofing cores also permits an opportunity to determine the roof system cross-section, the membrane thickness, and to check for moisture below the roof membrane. In these instances, we regularly examine the sample under magnification, and then remove the bitumen from the core with solvent to examine the reinforcing for strain and tears characteristic of impacts.  Once the roofing has been cut, you can use a tool like the Haag Panel and Membrane Gauge™ to measure and document the thickness of the membrane for your file Hail damage to single-ply roofing systems typically is discernible in the field; however, it may be helpful to remove cores from the roofing and examine areas of interest with a microscope and/or high intensity backlighting to identify fractures caused by hailstone impacts (particularly with TPO products).


With respect to windstorm evaluations, we need to recognize that a building has widely varying force levels on its roof surfaces.  It is reasonable to expect the most severe wind damage to occur at the windward corners and edges of the roof where wind forces are the strongest.  It is for this reason that building codes require more uplift resistance capacity for roofing in these areas.  In fact, it is not uncommon for roof fastener patterns on shoreline structures and tall buildings to

require 50 percent more fasteners along the edges and 100 percent more fasteners in roofing corners than in the field of the roof.  If wind forces have reached levels strong enough to damage the common commercial roofing systems, there typically is some combination of lifted, torn, and/or peeled roofing concentrated where wind forces are the strongest (ie. at the windward edges and corners of the roof).  Additionally, we should examine the roof system at roof penetrations to look for wrinkles and tears or any other evidence of membrane displacement.  If we find that roofing failure has occurred at wind speeds less than expected, we should examine and document the roof system attachment within those areas.  Often premature failure occurs due to inadequate fasteners, inadequate adhesion, or some combination of the two.  Situations such as these may be significant subrogation opportunities.  In these instances, it is particularly important to turn back all of the roofing layers to properly evaluate the roof and support your conclusions.  The layers of roofing, their attachments, and their performance tell the story; all we have to do is know how to read it.


Kenneth R. Gilvary is a licensed Professional Engineer in 16 states. He was employed by Haag Engineering Co. from 2003-2017. He has extensive experience with design, construction administration, and evaluation of large-scale projects involving multiple buildings.  He currently sits on the Board of Directors of the Windstorm Insurance Network (WIND), Inc., and the Property Loss Research Bureau (PLRB) planning committee.  He is a member of the ASTM E-06 Performance of Buildings Committee and is a developer. He was an instructor for the Haag Certified Inspector (HCI) programs. Ken also is an All-Lines Insurance General Adjuster licensed in Florida with experience in adjusting large commercial losses.

 

What Can Radar Tell Us About Hail? Nov. 2015

What can radar tell us about hail?

By Tim Marshall, P.E., Meteorologist, Haag Principal Engineer

Have you ever wondered whether National Weather Service (NWS) radars can tell if it hailed on a particular roof?  There is a high probability it can!   Radar information is available online from the National Climatic Data Center at: https://www.ncdc.noaa.gov/data-access/radar-data as well as other sources.  Haag engineers and meteorologists routinely study radar images or analyses to determine the likelihood that hail fell at a specific location. Such information can help our clients better understand hail history.  Radar studies have shown good correlation in determining hail aloft and whether it reaches the ground.  However, there are too many uncertainties with weather radar to accurately tell maximum hail size at a particular location.  While some organizations provide such algorithm output, this type of data must be reviewed with caution and correlated with all other available evidence.  Haag engineers and meteorologists conduct site specific inspections to verify if it hailed and determine the size, hardness, and direction of hail fall.  We look for the presence of scuff marks on wood surfaces and spatter marks on metal and other surfaces that have oxidation, grime, and organic growths.  Such marks are usually visible within a year or two after the hail event. Radar output does not take the place of detailed site specific inspections.

The following is a short treatise on radar to better explain what it can and cannot do.  Radar is an acronym that stands for Radio Detection and Ranging.  It was developed during WWII to track aircraft and missiles.  Advancements in technology have greatly improved radar quality and resolution over the years.  Today, there are more than 150 weather radars operated by the National Weather Service throughout the U.S.

These radars emit extremely short bursts of radio waves, called pulses. Each pulse of energy lasts about 0.00000157 seconds (1.57×10⁻⁶), with a 0.00099843-second (998.43×10⁻⁶) “listening period” in between.

The transmitted radio waves move through the atmosphere at about the speed of light.  By knowing the direction the antenna is pointed, and timing of returned energy, the location of the target can be determined. Generally, the better the target is at reflecting radio waves (i.e., more raindrops, larger hailstones, etc.), the stronger the reflected radio waves, or echo, will be.  This is because the energy reflected is proportional to the target diameters to the sixth power.  The radar antenna is 28 feet wide and contained within a fiberglass radome to protect it from the weather.  The antenna is mounted on a tower to limit interference of near ground obstructions (Figure 2).  Every five minutes or so, the radar conducts a volume scan, rotating up to 19.5 degrees above the horizon, and providing a “snapshot” of echo intensity and location.  Radar cannot see above 19.5 degrees which might not even see a storm very close to the radar site. The area not sampled above the radar is called the “cone of silence” (Figure 3).  Also, radar does not sample below 0.5 degrees to minimize ground interference and radiating people.

The radar antenna samples the returned energy at some height above the ground.  Also, radar resolution decreases with increasing distance as the radar beam widens and rises above the ground; the latter occurs due to the curvature of the earth.   Just because radar might detect hail aloft, does not necessarily mean it will fall directly below at the ground.  This is because winds aloft can blow hailstones downstream.  Also, hail melts as it falls into increasingly warmer air.  So, the depth of the warm air is important.

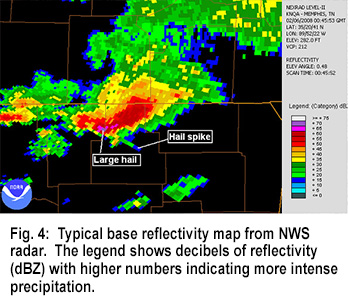
Received radar energy goes through electronic processing where computer algorithms dissect the data so that it can be displayed. Three-dimensional information is placed into color-coded bins on a two-dimensional map of the area.  Figure 4 shows a display of radar reflectivity.  Green colors indicate light precipitation, yellow moderate precipitation, and red intense precipitation.  Darker red and purple colors indicate a high probability of hail at that altitude.  Sometimes, a false echo or spike is found emanating from a radar echo which also indicates the presence of hail. Super Resolution data provides base radar reflectivity at 0.5 degree azimuth by 250 m range gate, which is much larger than a building roof.  Figure 5 shows a close-up view of base reflectivity showing the size of a radar bin that was 15 miles from the radar.  The size of the radar bin was much larger than that of a house.  Thus, radar cannot sense hail at a point.

In the past few years, NWS radars have upgraded to dual polarization (Dual-Pol) technology.  Such radars send out horizontal and vertical pulses of energies which provide more information about precipitation type.  Rain typically falls like flat plates (not the typical drop shape that kids draw) while hail is generally rounded (roughly spherical).  Thus dual-pol radars can better distinguish rain from hail, but the resolution is still not fine enough to distinguish the sizes of individual hailstones .  This improvement still has the same limitations as single-wave radars.  Despite these limitations, weather radar is a valuable tool used in the prediction of hail.  But, a prediction is not a verified result. Radar cannot tell the specific size(s), quantity, direction(s), or hardness, of hailstones at a particular address, or whether the hail actually caused any damage to roofing or other exterior building components. Verification requires ground truth and Haag experts routinely perform such site specific inspections. Since the purpose of site inspections is to determine the extent and severity of damage to building materials, and not simply to determine the whether hail fell or the size of hail, radar data will not replace the need to have well-trained inspectors make evaluations.

Fig. 1
National Doppler Radar Site locations.  (Sept. 8, 2015).  [Map illustration of the NWS Radar Sites].  National Doppler Radar Sites.  Retrieved from http://radar.weather.gov/.
Fig. 2
NEXRAD Doppler Site Image.  (Sept. 8, 2015).  [Doppler radar site at sunset.]  Retrieved from http://www.noaanews.noaa.gov/stories2013/images/WSR-88D_Tower.jpg .
Fig. 3
Radar Limitations.  (Sept. 8, 2015).  [Graphic showing radar beam characteristics.] Cone of Silence. Retrieved from http://www.srh.noaa.gov/jetstream/doppler/radarfaq.htm .
Fig. 4 
Hail Storm, Memphis, TN, 02/06/2008.  (Sept. 8, 2015).  [Doppler Radar image showing a storm moving over Memphis on 02/06/2008.]  Available online at  http://www.roc.noaa.gov/WSR88D/About.aspx .
Fig. 5 
NEXRAD Image, Dallas, TX, 05/25/2011.  (Nov. 2, 2015).  [Doppler Radar image showing a house point on radar.]  Available online at  http://www.roc.noaa.gov/WSR88D/About.aspx .

By Tim Marshall, P.E., Meteorologist, Haag Principal Engineer

Tim Marshall is a structural engineer and meteorologist.  He has served as a Haag Engineer since 1983, assessing damage to 1000s of structures (particularly damage caused by wind and other weather phenomena). He has written numerous articles, presented countless lectures, and appeared on dozens of television programs in order to share his extensive knowledge re: storms and the resultant damage.  He is a primary author of many Haag Education materials, including the Haag Certified Inspector-Wind Damage course. He is also a pioneering storm chaser and was editor of Storm Track magazine.

___

Any opinions expressed herein are those of the author(s) and do not necessarily reflect those of Haag Technical Services, Haag Engineering Co., Haag Education, or parent company, Haag Global, Inc.

March 2018 Blog Post


What can radar tell us about hail?


Have you ever wondered whether National Weather Service (NWS) radars can tell if it hailed on a particular roof?  There is a high probability it can!   Radar information is available online from the National Climatic Data Center at: https://www.ncdc.noaa.gov/data-access/radar-data as well as other sources.  Haag engineers and meteorologists routinely study radar images or analyses to determine the likelihood that hail fell at a specific location. Such information can help our clients better understand hail history.  Radar studies have shown good correlation in determining hail aloft and whether it reaches the ground.  However, there are too many uncertainties with weather radar to accurately tell maximum hail size at a particular location.  While some organizations provide such algorithm output, this type of data must be reviewed with caution and correlated with all other available evidence.  Haag engineers and meteorologists conduct site specific inspections to verify if it hailed and determine the size, hardness, and direction of hail fall.  We look for the presence of scuff marks on wood surfaces and spatter marks on metal and other surfaces that have oxidation, grime, and organic growths.  Such marks are usually visible within a year or two after the hail event. Radar output does not take the place of detailed site specific inspections.

The following is a short treatise on radar to better explain what it can and cannot do.  Radar is an acronym that stands for Radio Detection and Ranging.  It was developed during WWII to track aircraft and missiles.  Advancements in technology have greatly improved radar quality and resolution over the years.  Today, there are more than 150 weather radars operated by the National Weather Service throughout the U.S.  (Figure 1).

These radars emit extremely short bursts of radio waves, called pulses. Each pulse of energy lasts about 0.00000157 seconds (1.57×10⁻⁶), with a 0.00099843-second (998.43×10⁻⁶) “listening period” in between.

The transmitted radio waves move through the atmosphere at about the speed of light.  By knowing the direction the antenna is pointed, and timing of returned energy, the location of the target can be determined. Generally, the better the target is at reflecting radio waves (i.e., more raindrops, larger hailstones, etc.), the stronger the reflected radio waves, or echo, will be.  This is because the energy reflected is proportional to the target number and target diameter to the sixth power.  The radar antenna is 28 feet in diameter and contained within a fiberglass radome to protect it from the weather.  The antenna is mounted on a tower to limit interference of near ground obstructions (Figure 2).  Every five minutes or so, the radar completes a volume scan, rotating up to 19.5 degrees above the horizon, and providing a “snapshot” of echo intensity and location.  Radar cannot see above 19.5 degrees which might not even see a storm very close to the radar site. The area not sampled above the radar is called the “cone of silence” (Figure 3).  Also, radar does not sample below 0.5 degrees to minimize ground interference.

The radar antenna samples the returned energy at some height above the ground.  Also, radar resolution decreases with increasing distance as the radar beam widens and rises above the ground; the latter occurs due to the curvature of the earth.   Just because radar might detect hail aloft, does not necessarily mean it will fall directly below at the ground.  This is because winds aloft can blow hailstones downstream.  Also, hail melts as it falls into increasingly warmer air.  So, the depth of the warm air is important.

Received radar energy goes through electronic processing where computer algorithms dissect the data so that it can be displayed. Three-dimensional information is placed into color-coded bins on a two-dimensional map of the area.  Figure 4 shows a display of radar reflectivity.  Green colors indicate light precipitation, yellow moderate precipitation, and red intense precipitation.  Darker red and purple colors indicate a high probability of hail at that altitude.  Sometimes, a false echo or spike is found emanating from a radar echo which also indicates the presence of hail.  Figure 5 shows a close-up view of base reflectivity showing the size of a radar bin that was 15 miles from the radar.  The size of the radar bin was much larger than that of a house.  Thus, radar cannot sense hail at a point.

In the past few years, NWS radars have upgraded to dual polarization (Dual-Pol) technology.  Such radars send out horizontal and vertical pulses of energies which provide more information about precipitation type.  Rain typically falls like elliptical plates (not the typical drop or round shape that kids draw) while hail is generally rounded (roughly spherical).  Thus dual-pol radars can better distinguish rain from hail, but the resolution is still not fine enough to distinguish the sizes of individual hailstones .  This improvement still has the same limitations as single-wave radars.  Despite these limitations, weather radar is a valuable tool used in the prediction of hail.  But, a prediction is not a verified result. Radar cannot tell the specific size(s), quantity, direction(s), or hardness, of hailstones at a particular address, or whether the hail actually caused any damage to roofing or other exterior building components. Verification requires ground truth and Haag experts routinely perform such site specific inspections. Since the purpose of site inspections is to determine the extent and severity of damage to building materials, and not simply to determine the whether hail fell or the size of hail, radar data will not replace the need to have well-trained inspectors make evaluations.


Fig. 1
National Doppler Radar Site locations   [Map illustration of the NWS Radar Sites].  National Doppler Radar Sites.  Retrieved from http://radar.weather.gov/.
Fig. 2
NEXRAD Doppler Site Image   [Doppler radar site at sunset.]  Retrieved from http://www.noaanews.noaa.gov/stories2013/images/WSR-88D_Tower.jpg .
Fig. 3
Radar Limitations   [Graphic showing radar beam characteristics.] Cone of Silence. Retrieved from http://www.srh.noaa.gov/jetstream/doppler/radarfaq.htm .
Fig. 4 
Hail Storm, Memphis, TN   [Doppler Radar image showing a storm moving over Memphis]  Available online at  http://www.roc.noaa.gov/WSR88D/About.aspx .
Fig. 5 
NEXRAD Image, Dallas, TX   [Doppler Radar image showing a house point on radar.]  Available online at  http://www.roc.noaa.gov/WSR88D/About.aspx .

By Tim Marshall, P.E., Meteorologist, Haag Principal Engineer


Tim Marshall is a structural engineer and meteorologist.  He has served as a Haag Engineer since 1983, assessing damage to 1000s of structures (particularly damage caused by wind and other weather phenomena). He has written numerous articles, presented countless lectures, and appeared on dozens of television programs in order to share his extensive knowledge re: storms and the resultant damage.  He is a primary author of many Haag Education materials, including the Haag Certified Inspector-Wind Damage course.  He is also a pioneering storm chaser and was editor of Storm Track magazine.  See his profile here.

October 2015 Blog Post

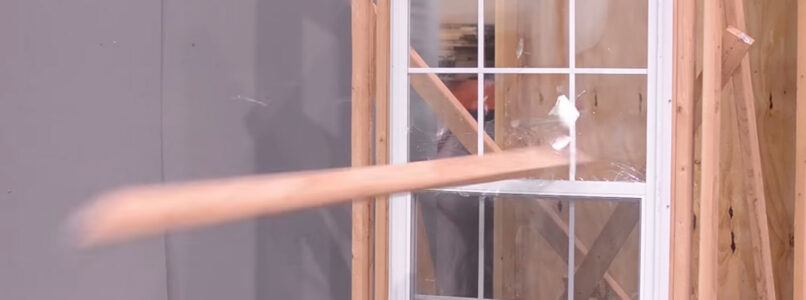
Haag’s Research & Testing laboratory, which plays a crucial role in the development of Haag courses and publications, has earned its accreditation from the International Accreditation Service (IAS) for product testing! Watch this video blog post for a behind-the-scenes look into the exciting tests performed in the lab (including impact testing with 2x4s and 4″ ice balls!).

video tour: Launching 4″ Ice balls & More!


UTILIZING VIRTUAL TOURS IN DAMAGE ASSESSMENT, September 2015 Blog

UTILIZING VIRTUAL TOURS IN DAMAGE ASSESSMENT

By Kevin Kianka, P.E.

If “a picture is worth 1,000 words,” how valuable is the capability to place yourself within an image and pan around?  Or even zoom in?

I call it the “Google Street View effect”:  the desire of tech-savvy users to control their own movements within images and videos that have been taken elsewhere, by someone else.  Though Google’s Street View service is perhaps the most well-known use of this type of technology and has been available for almost eight years, panoramic virtual tours have been utilized in the real estate industry for nearly twice as long.  Now a new wave of users in the damage assessment industry are finding that virtual tours can be extremely useful during inspection and construction.  Utilizing specialized cameras, lenses and software, photographers can create 360° spherical imagery of a specific location, allowing other viewers to become virtual on-site witnesses.

What Type of Equipment is Needed?

Haag has used spherical photography and virtual tours for over three years on a variety of projects, including damage assessments, incident documentation, construction monitoring, and historical documentation and recordation, just to name a few.  The process involves image acquisition, photo stitching/merging, and tour creation.  Hardware includes a standard DSLR camera and photographic tripod, a fisheye lens, and spherical camera mount.

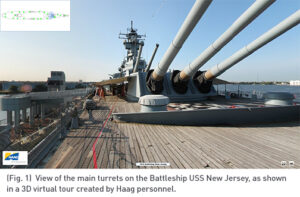
The camera tripod is set and a series of photographs are taken (typically 6) utilizing the camera mount.  The spherical camera mount has settings that ensures that there is a 360° horizontal coverage, creating the spherical image.  (Some specially-designed cameras can even take a 360° image without any manual effort.)  The camera system is then moved to the next desired location and the process repeated until all desired locations are documented.  Typical setup locations include any key Points of View (or POV, see Fig. 1), witness locations, areas where damage is present, and areas that show inconsistencies in construction or manufacture (or anything out of the ordinary for a scene).

Later, back in the office, users stitch the six individual images together, creating a final spherical image for every noted setup location.  Tours can then be  created utilizing specialized software which combines the multiple spherical images into a single file.  This file can be linked to a map with a “radar” showing the POV of the camera, along with links to all the photographs, videos and PDFs used within each spherical image.  (The map is typically created to allow the tour users to have a point of reference in the context of the whole scene.)

The end product can be delivered as a self-executable file (EXE), or it may be loaded onto a website or mobile device, among other formats.  Key information can be placed within the virtual tour, including still photographs, field notes, videos, links to OSHA standards or websites, or other applicable documentation.  The resulting product allows persons never on a site to “be there” with the photographer.  They can see “first-hand” notable conditions and, crucially, view a photograph within the surrounding context while controlling their movements in the virtual space.

See a 3D Tour in Action

Check out an example of a virtual tour here.  In this short video of a 3D Tour created by Haag personnel, you’ll be able to see how easily a viewer can maneuver through a Virtual Tour of the Battleship USS New Jersey.


Kevin Kianka, P.E., Director of Haag BIM/Modeling Program, 07/2015

Kevin Kianka, P.E., serves as the Director of BIM/Modeling Program for Haag Technical Services, overseeing the office production of deliverables for clients, in addition to serving as a Project Manager on multiple projects. He recently spearheaded the effort to petition for and obtain Haag’s FAA Section 333 ExemptionSee his profile and contact information here.


Ready to Utilize Drones on the Job? Factors to Consider in Commercial Use, July 2015 Blog

Ready to Utilize Drones on the Job? Factors to Consider in Commercial Use

By Kevin Kianka, Operations Manager, Technical Services

Drones are a hot topic in the media these days, whether they are being used to help report the news (such as to show recent flooding in Houston) or whether they are the actual topic of the news (such as when drones impacted the airspace of a jet on its final approach to LaGuardia Airport and led to flight diversions).  While the term “drone” is used most often in the media, the official Federal Aviation Administration (FAA) designation is Unmanned Aircraft System (or UAS).  Other designations include quadcoptor, unmanned aerial vehicle, and unmanned aerial system.

Regardless of what you call it, the UAS is fast becoming a valuable asset to the architecture, engineering, inspection, real estate and insurance industries.  Previously inaccessible areas and views of properties are now obtainable via the use of a UAS. And the control is literally in the user’s hands.  A UAS can be utilized to provide documentation of damage and collapses, aerial views, and other images that were previously too costly on small to moderate projects.  Now the UAS provides cost effective options that were once unobtainable for the average homeowner or inspector.

However, before you go out and buy a system or hire someone to perform a service using a UAS, there are several factors which must be considered.

First, before you fly, it is imperative that you determine whether you have permission and authorization to fly.  If you are going to fly a UAS inside of a building or enclosed space, permission from your client and the property owner/manager will get you started.  Note that the industry you are working in may have additional restrictions or requirements.  Make sure you check all available resources to determine if there are any restrictions to your indoor use of a UAS.

If you move outside, additional regulations impact you:  specifically and most importantly, those regulations which are established by state and federal agencies.  In addition to obtaining permission from your client and the property owner, you must determine if the US state you are working in allows the use of a UAS for commercial purposes, as individual states are legislating UAS usage.  The commercial use of a UAS in open airspace is further regulated by the FAA.  As of the date of this document, such use requires you to obtain FAA Section 333 Exemption for any commercial application; governmental operations have different requirements.  (Note: Haag Engineering Co. recently received approval to utilize UAS systems under the FAA Section 333 Exemption.  For more information on all we can offer, read the press release here.)  The Section 333 exemption comes with additional requirements.  To name a few, not only must a FAA-licensed pilot operate the UAS, but s/he must do so from an area that is at least 500’ away from all nonparticipating persons or structures.  The pilot may work only over a private or controlled-access property, and the pilot must obtain express permission from the owner.

Once you have determined that you actually have permission to fly, you can analyze and identify the hardware that you’ll need to do the job.

A UAS can vary in cost from several hundred dollars to tens (if not hundreds) of thousands of dollars.  Selecting the right UAS is an involved process, and the actual UAS itself is just one piece of the puzzle. Users also need to consider what data they are trying to collect and what they are going to do with that data.  Whether you are using a digital camera, FLIR, LIDAR, or other type of apparatus, data acquisition is required to document the view from the UAS.  The next and most important piece of the puzzle to define what you are going to do with your data.  Are you simply taking pictures?  Do you want to take measurements from the data?  Do you want to create panoramic images?  These are many questions that need to be answered before someone implements the use of a UAS.

In addition, training is crucial.  Do not expect to purchase a UAS on Monday and use it on Tuesday.  It is best to plan on several days and weeks (if not months) of practice using the hardware and software before utilizing it on a paying project.

Importantly, a UAS will not replace a required workflow; it will only assist you in completing that workflow.  Likely, an inspector will still need to access a roof or complete a hands-on inspection of a bridge or apparatus to complete her/his analysis.  For example, an aerial image might indicate circular areas of granule loss on an asphalt roof; a crack in an elevated concrete structure; cracking in the pavement of a parking lot; or damage to elevated piping in a facility.  However, a hands-on inspection is still required to confirm the severity and extent of any damage captured visually by UAS data.  The UAS is merely a tool to assist in that process.

Below are some basic questions that you should ask before you consider using a UAS.

  • Does the client allow the use of a UAS?
  • Will the property owner/manager/controller allow the use of UAS?
  • What data are you trying to collect and what are you going to do with it?
    • Can you perform the data processing internally or will a consultant be required?
    • If a consultant is required, is s/he qualified to do this work and what will the cost be?
    • Will the data meet the accuracy and precision needs for the project?
    • Do you (or your consultant) have the data-processing expertise needed to produce reliable and defendable results?
    • Will the UAS be operated outdoors?
      • Does the city, county and/or state where the services are being performed allow the use of a UAS?
      • Do you or your employer have a FAA Section 333 Exemption?
      • Does the UAS Operator (Pilot in Charge) hold either an airline transport, commercial, private, recreation or sport pilot certificate from the FAA?
      • Will the UAS operate at least 500’ from all nonparticipating persons, vessels, vehicles or structures, unless protected by a barrier?
      • Will the UAS operate over private or controlled-access property with permission from the property owner/controller or authorized representative?

Once these are satisfactorily answered, you may be well on your way to using a drone for the first time on the job!


Kevin Kianka, P.E., serves the Director of Operations, based in Haag’s Sugar Land (Houston), TX office and leading Haag Technical Services efforts nationwide, including all services related to 3D Laser Scanning, 3D Modeling, Drones (sUAV’s), GIS, and other advanced technologies. A licensed Professional Engineer in Texas, New Mexico, Colorado, New Jersey, New York, Pennsylvania and Florida, Mr. Kianka obtained a Bachelor of Science in Civil Engineering from Drexel University (Philadelphia, PA) and has over 15 years of experience in the field of Engineering.

Earthquake Risk Assessment:  Can We Predict the Next ‘Big One’? May 2015 Blog

EARTHQUAKE RISK ASSESSMENT:  CAN WE PREDICT THE NEXT ‘BIG ONE’?

By David L. Teasdale P.E., Haag Principal Engineer

An earthquake is little more than a release of energy when two sides of a fault line slip relative to each other.  A fault is a break in the rock crust, generally miles below the surface, and faults were created long ago as tectonic plates drifted to their current positions.

Therefore, all parts of the United States have fault lines, and any part of the United States has the potential for an earthquake as the tectonic plates continue moving.  As might be expected with any moving, flexible plate, parts of that plate move differently, and the plate surface deforms.  (Recall from high school geology that the rise of mountains and other land features is attributed to this deformation.)  Continued plate movement and localized surface deformations cause different sides of a fault to bind against each other, and binding builds up internal strains in the rock.  Built-up energy may eventually be released through slipping along a fault line, and we feel that slip as an earthquake.

While every part of the United States has fault lines, not every fault line is actively moving and binding, and those that are active are not storing energy at the same rate or in the same kind of rock geology.  Therefore, the risk of an earthquake varies by region for many different reasons, and risk assessment is hampered by the sheer size of the moving parts, the variability of materials, and our understanding of the process.  Presently, risk assessment is based on the size and frequency of past earthquakes.  California is on the leading edge of North American plate, and faults are more active, as it collides with the Pacific Plate to the west and rides up over the “subduction zone”. (Refer to  http://www.sanandreasfault.org/Tectonics.html for further explanation.)

It is presently believed that periodic release of energy through smaller earthquakes helps prevent a larger earthquake, but discovery of new faults and awakening of dormant faults is ongoing with time.  No scientist knows precisely what might happen next, and consideration of the unknown always fuels discussion of the inevitable “big one”.

Study of California geology and past earthquakes leads seismologists to consider the maximum credible event around a magnitude 8.0.  Magnitudes are logarithmic, and each magnitude level is about 32 times greater than the previous one (M5 is32 times greater than M4).

Therefore, the maximum credible event for California is more than 1,000 times greater than the Northridge earthquake in 1994 (M6.7).  Buildings of different age, construction materials, and design behave differently when shaken, but good detailing of connections goes a long way toward safely resisting earthquake shaking.  In the United States, one can generally assume that most buildings will perform well with little damage at magnitudes below 5.0, even when they are not constructed using earthquake standards, but damage is influenced by magnitude, duration of shaking, distance from the involved fault, depth of the earthquake focus, frequency content, and other factors.

Earthquakes in the Midwest and other regions of the United States are much less frequent, but areas like the New Madrid fault, the Wasatch Fault, and the Middleton Place – Summerville Seismic Zone (Missouri, Utah, and South Carolina, respectively) have all experienced extraordinary shaking events in their histories similar to a maximum credible event in California.

The frequency of these events is around once every 500 years, on average, so residents of these areas may not feel the urgency about earthquakes that Californians might feel.  Residents of central Oklahoma routinely experience short shaking events up to about M3.5 without significant alarm.  Curiously, building codes handle the risk of infrequent strong events by including seismic requirements in design but reducing the force levels.  These measures will save lives in a surprise shake of moderate proportions, but they will not likely make much difference if these areas experience a large event.  Therefore, much of the United States is effectively “playing the averages” when it comes to earthquakes, but averages over geologic time are just that, averages.  The next one could be in 1,000 years or 100 years.

Much effort has been made to predict earthquakes, and these efforts usually involve measuring fault movements with the hopes of understanding when they are apt to slip.  Where the strain energy theory of earthquakes is prevalent, it is often thought that small tremors can presage a larger event, and seismologists have seen small excitations in their studies that might someday offer a reliable advance warning of several minutes or more.

Predicting how large that event might be, however, is still well beyond current knowledge.  Given the difficulties in evaluating earthquake initiation where faults can be studied over time, one can see the difficulty of evaluating fault activity in new areas like those where hydraulic fracking is underway, for example. Seismologists can postulate theories as to how water injection might lubricate faults and cause movement, but moving the earth is not as easy as all that. Further study of a region along with consideration of other factors like depth, procedures, and time lapse since the last injection often lead geologists to discount the effects of human activity. In the meantime, the rest of us can sleep better believing that a historically inactive region likely will not have a lot of strain energy stored in its faults, and small tremors will reduce that energy even if they result from human activity.  It’s as good a theory as any at this time.


David Teasdale, P.E., Haag Engineer

David Teasdale specializes in Structural Evaluations, Earthborne and Airborne Vibrations, Geotechnical Evaluations, General Civil Engineering, & Wind Engineering and Related Storm Effects.  He is the primary author and presenter of a Haag seminar course on earthquake damage assessment titled “California Earthquake Adjuster Accreditation“.  See his profile here.