Month: September 2022

REV Recreation Group is Recalling Various 2018-2023 Motorhomes

NHTSA Campaign Number: 22V655000

Manufacturer REV Recreation Group

Components SUSPENSION

Potential Number of Units Affected 4,395

Summary

REV Recreation Group (REV) is recalling certain 2018-2019 Fleetwood Jamboree, 2020-2023 Fleetwood Southwind, Bounder, Flair, Fortis, Holiday Rambler Admiral, Invicta, Vacationer, 2021-2023 Fleetwood Discovery, Discovery LXE, Holiday Rambler Navigator, Armada, Nautica, 2023 Fleetwood Flex, Holiday Rambler Eclipse, 2021 Fleetwood Pace Arrow LXE, 2018 Holiday Rambler Vesta, 2022-2023 Fleetwood Frontier, 2021-2022 Fleetwood Pace Arrow, Holiday Rambler Endeavor, and 2019 Holiday Rambler Augusta motorhomes. The hydraulic lines may have been improperly routed, secured, or protected, which can result in a hydraulic fluid leak.

Remedy

Dealers will inspect the hydraulic hoses for chafing or heat damage, and install hose protection, or replace them as necessary, free of charge. Owner notification letters are expected to be mailed October 28, 2022. Owners may contact REV customer service at 1-800-509-3417.

Notes

Owners may also contact the National Highway Traffic Safety Administration Vehicle Safety Hotline at 1-888-327-4236 (TTY 1-800-424-9153), or go to www.nhtsa.gov.

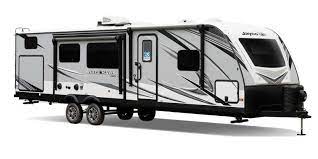
Jayco is Recalling Certain 2022-2023 White Hawk Travel Trailers

NHTSA Campaign Number: 22V659000

Manufacturer Jayco, Inc.

Components EQUIPMENT

Potential Number of Units Affected 45

Summary

Jayco, Inc. (Jayco) is recalling certain 2022-2023 White Hawk travel trailers. The refrigerator LP gas line may have been improperly routed and concealed in the underbelly of the trailer.

Remedy

Dealers will reroute the refrigerator LP gas line, free of charge. Owner notification letters are expected to be mailed September 30, 2022. Owners may contact Jayco customer service at 1-800-283-8267. Jayco’s number for this recall is 9901579.

Notes

Owners may also contact the National Highway Traffic Safety Administration Vehicle Safety Hotline at 1-888-327-4236 (TTY 1-800-424-9153), or go to www.nhtsa.gov.
Effects of Hail-Caused Dents on the R-value of Roof Insulation

Effects of Hail-Caused Dents on the R-value of Roof Insulation

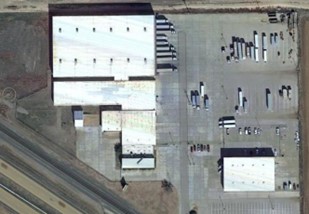
The subject property was a distribution center in Texas with several large buildings covered with single-ply, thermoplastic polyolefin (TPO) membrane roofs installed over various substrates. Concerns were raised regarding hail-caused damage to the roofs and the effects hail-caused dents had on the thermal properties of the insulation. A Haag engineer performed the roof inspection and provided samples of the TPO membrane and insulation substrates to our laboratory to determine if hail-caused dents in the substrates had reduced the insulation R-value.

Figure 1: Overview of property

Four substrate samples were provided to our laboratory. Substrates included various thicknesses of polyisocyanurate insulation (polyiso), including two topped with gypsum coverboard. Table 1 summarizes substrate configurations.


Table 1: Sample Descriptions

Sample

Substrate

1

1/2-inch gypsum coverboard over 3-1/2 inches of polyiso

2

4 inches of polyiso

3

2 inches of polyiso

4

1/2-inch gypsum coverboard over 2-1/2 inches of polyiso


Figure 2: Samples 1 through 4 (left to right)

Each substrate sample contained a hail-caused dent centered on the sample. Laboratory personnel prepared each sample for R-value testing by conditioning in a laboratory oven to remove any residual moisture (absorbed humidity) and trimmed the samples to fit inside our heat flow meter (HFM), which is used to perform ASTM C518 – Standard Test Method for Steady-State Thermal Transmission Properties by Means of the Heat Flow Apparatus. Samples were then tested to determine their baseline R-values.

Figure 3: Sample 3 prepared to insert into the HFM (left) and inside the HFM (right)

Test parameters were chosen such that the bottom of each sample was in contact with a cold plate set at 75 degrees Fahrenheit and the top surface of each sample was in contact with a hot plate set at 145 degrees Fahrenheit. These temperatures were selected in accordance with ASTM C1058 – Standard Practice for Selecting Temperatures for Evaluating and Reporting Thermal Properties of Thermal Insulation because they represent in service temperatures of a roof on a hot summer day (upper plate) and a conditioned space below the roof (lower plate).


After baseline R-values were measured, a single dent was added to each sample that was similar in size and depth as the existing hail-caused dents and the R-values were remeasured. Test results are summarized in Table 2. The measured R-values after denting were then compared to the baseline R-values. Review of the measured R-values revealed the differences in R-value in the dented configurations versus baseline values for each sample fell within the accuracy of the HFM, which is +/- 2%.

Figure 4: Samples 1 through 4 (left to right) after adding dents

Table 2: Measured R-values

Sample

R-value (Baseline)

R-value

(After Denting)

Difference (percent)

1

12.62


12.48


-1.1


2

16.05


16.05


0.0


3

8.76


8.75


-0.1


4

11.07


11.05


-0.2


An additional consideration, is the R-value measurements taken within the HFM are made within a 4-inch by 4-inch region (metered region) in the center of the HFM. Also, one dent in the insulation is the smallest number of dents that can be measured for comparison. One square of roofing (100 square feet) is 900 times larger than the metered region within the HFM. For this reason, the differences in R-values listed in Table 2 represent a hail dent frequency of 900 hail-caused dents per square. The engineer that performed the roof inspection reported between two and seven hail-caused dents per square in the various substrates. Consequently, the hail-caused dents had no measurable effect on the R-value of the insulation. 

ASTM Wind Test on Concrete Roof Tiles

ASTM Wind Test on Concrete Roof Tiles

The subject property was an apartment complex in Florida. Roofs were covered with Spanish-profile, concrete roof tiles. Concerns were raised regarding wind-caused damage to the roof tiles and specifically, what minimum wind speed could potentially displace the tiles. An inspection of the roofs was conducted by an outside roof consultant (non-Haag).

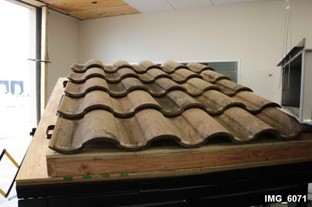
The client provided exemplar roofing tiles to our laboratory and detailed the tile installation at the site. Tiles were installed atop plywood roof decking, supported by wood battens, and mechanically attached with 2-1/2 inch long screws. Test panels were constructed, and tiles were installed to replicate tile installation at the property.  

Figure 1: Tiles installed on a 5-corse test panel
Figure 2: Tile installation including fastener head stand-off and tile exposures

Tiles were tested in substantial conformance with ASTM D3161 – Standard Test Method for Wind Resistance of Steep Slope Roofing Products (Fan-Induced Method). Test panel configurations were modified as permitted by ASTM D3161 to develop additional information, including variations in slope angle, orientation to the wind stream, and fastened condition. A summary of test configurations is provided in Table 1.

Table 1: Tile Test Configurations


Fasteners

Test No.

Deck Slope

Orientation to Wind
Stream (degrees)

Field

Top Course

1

2:12

0

A

B

2

4:12

0

A

B

3

4:12

30

A

B

4

4:12

60

A

B

5

4:12

0

C

B

A

one screw with 1/4-inch stand-off

B

one screw flush with tile surface

C

no fasteners in field, bottom course left with condition A

Our wind generator was programmed to ramp to 40 miles per hour (mph) in 60 seconds, then linearly ramp to 170 mph over 390 seconds (6-1/2 minutes), giving an average ramp speed of 10 mph every 30 seconds after the initial 60 second ramp. The wind generator program was manually terminated if/when a failure condition was reached. Tests were recorded using three video cameras in the test room, including an overhead view, a side view, and an angular view, to visually document the effects the wind stream had on the tiles. Wind speed in miles per hour (mph) was superimposed on the video stream providing a real-time correlation between wind speed and test conditions.

Table 2: Test Results


Wind Speed at Critical Moments (mph)


Test No.

First Tile Movement

Field Tile Lift

Field Tile Displacement

Lift-to-Displacement Differential (mph)

1

143

145


145

0

2

141

147


147

0

3

137

145


158

13

4

131

144


149A

5

5

124

138


139

1

Note A:

Tiles lift, shift, and hold, but do not separate from deck at max speed

Figure 3: Test 1 screen shots before lift and after failure (left to right)
Figure 4: Test 2 screen shots before lift and after failure (left to right)
Figure 5: Test 3 screen shots before lift, start of failure, and after failure (left to right)
Figure 6: Test 4 screen shots before shift, start of shift and maximum shift (left to right)
Figure 7: Test 5 screen shots before lift and after failure (left to right)

Testing demonstrated tiles installed in the same manner as they were at the subject property could be displaced by wind speeds of 147 mph and unfastened field tiles could be displaced by wind speeds of 139 mph. Testing also showed wind approaching from different angles (offset by 30 degrees and 60 degrees) would have minimal effect on tile performance, requiring slightly higher wind speeds to displace tiles. Importantly, testing also showed that wind speed sufficient to barely lift the tiles would rapidly displace the tiles. This is due to the aerodynamics changing as air is allowed to impinge on the bottom of tile surfaces once lifting occurs.

Real-Time, Interactive Storm Data: Haag Hurricane GeoPortal, Sept. 2022

HURRICANE GEOPORTAL: real-time, INTERACTIVE storm data

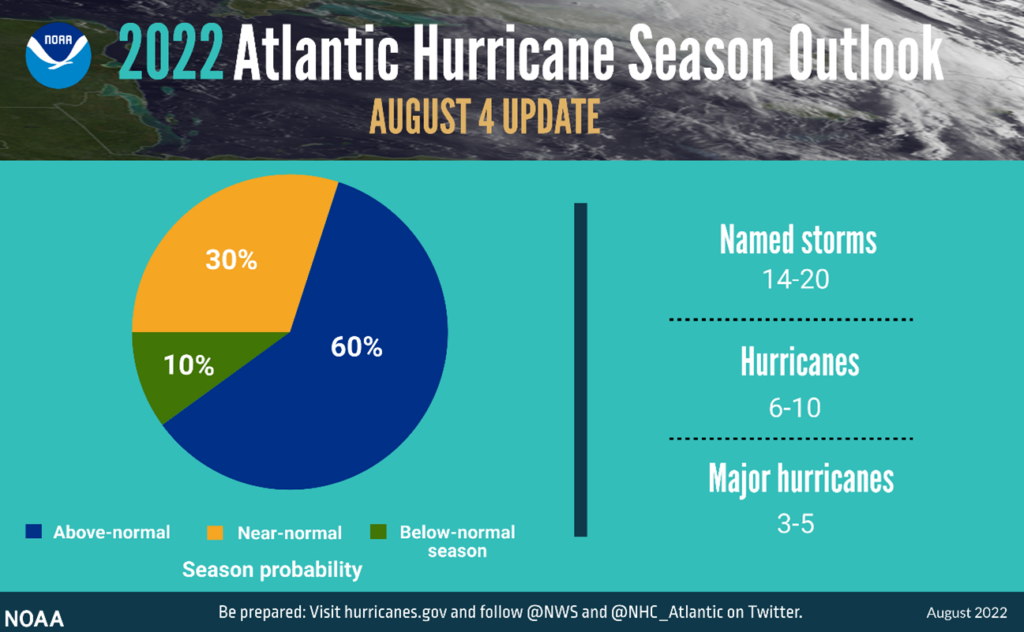
According to the National Oceanic and Atmospheric Administration’s (NOAA) annual mid-season update issued by the Climate Prediction Center, atmospheric and oceanic conditions still favor an above-normal 2022 Atlantic hurricane season. NOAA’s update to the 2022 outlook — which covers the entire six-month hurricane season that ends on November 30th — calls for 14-20 named storms (winds of 39 mph or greater), of which 6-10 could become hurricanes (winds of 74 mph or greater). Of those, 3-5 could become major hurricanes (winds of 111 mph or greater). NOAA provides these ranges with a 70% confidence.

The updated 2022 Atlantic hurricane season probability and number of named storms.

Considering this outlook for 2022 as well as very active recent hurricane seasons, it is imperative for businesses and individuals to have quick and reliable access to key data points. Haag believes that there is no such thing as too much data if the data is organized, relevant, and easy to access. The Haag Hurricane Geoportal checks these boxes and much more. It gives power to the user to view multiple datasets, interact with the data, and decide which information is most valuable to them. The Haag Hurricane Geoportal utilizes a map-based interface to provide on-demand access to several useful data sources including:

  • Real-time data for active and recent storms from the current hurricane season
  • Detailed storm data from the past three hurricane seasons with options to filter data based on storm name
  • Wind speeds and pressure at observed positions along a storm’s path
  • Direct access to official National Hurricane Center (NHC) storm reports
  • Radar and aerial imagery data for storms
  • Access to local climatological data reports
  • NEXRAD radar mosaics for current and past storms
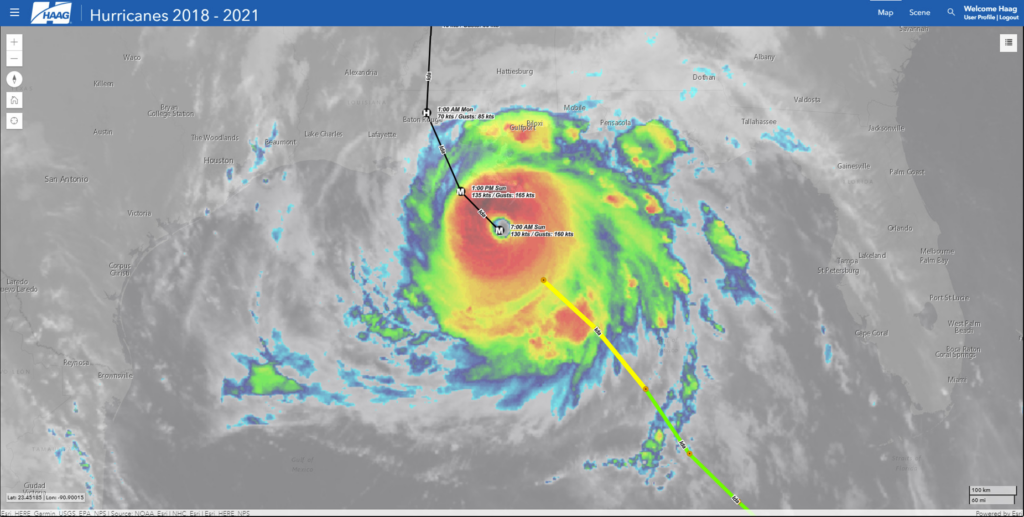
Satellite imagery, observed track and positions, forecasted track and positions of Hurricane Ida, August 2021.
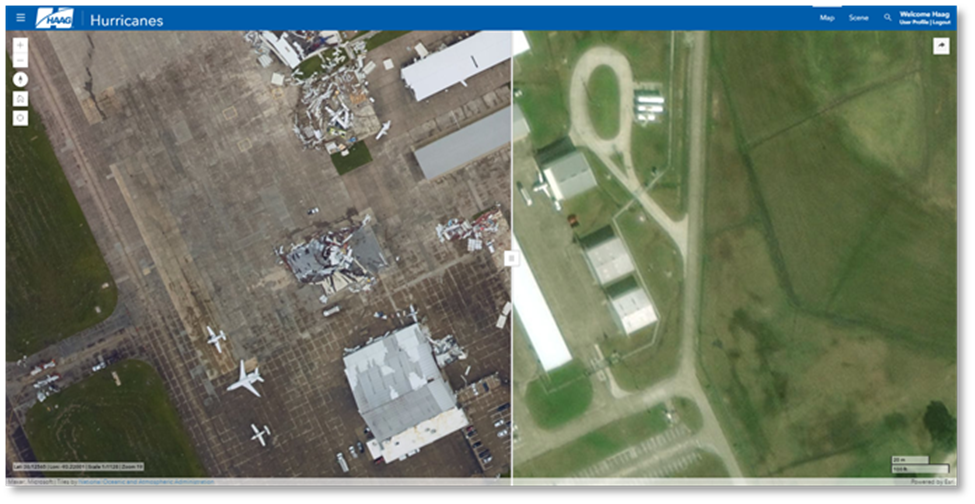
Before and after aerial imagery showing damages caused by Hurricane Laura, August 2020.

The Haag Hurricane Geoportal provides timely access to reliable data in one easy-to-use platform. While we can’t stop severe weather from happening, we can create tools to help make proactive planning and recovery much easier. The Hurricane Geoportal is your one-stop shop for keeping an eye on the data for the eye of the storm.

If you would like to learn more about the Haag Hurricane Geoportal, please contact Marcie Deffenbaugh, GIS Services Manager, to view a demo or for more information. Haag’s Hurricane Geoportal is available via subscription– one year subscription for $50/month or opt for a month-to-month subscription for $75/month.

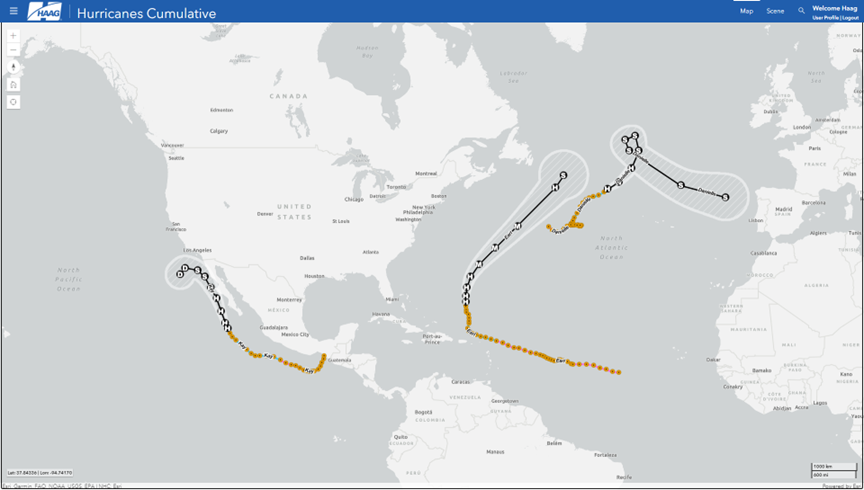
View of observed tracks and positions, as well as forecasted tracks, positions, and error cones of active storms as of 10:00 AM EST on 9/7/2022.
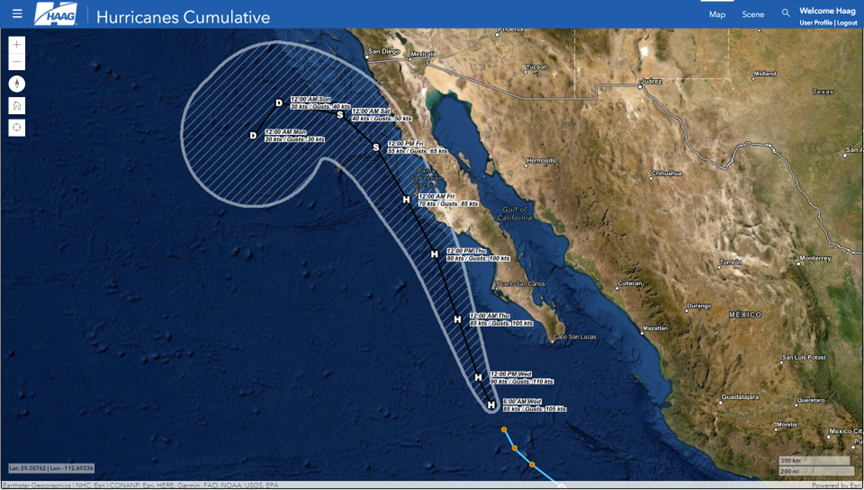
View of Hurricane Kay with forecasted track, position, and error cone as of 10:00 AM EST on 9/7/2022.

Marcie Deffenbaugh is the Manager of GIS Services for Haag Technical Services, a division of Haag Global, Inc.  In this role, Ms. Deffenbaugh oversees initiatives related to GIS planning, system design, and system administration. She also manages a staff of GIS technicians, analysts, cartographers, and project administrative assistants who provide data validation and project management services for oil and gas clients. As the primary liaison between the client management teams and Haag Technical Services personnel, Ms. Deffenbaugh provides technical consulting services on a regular basis.

___

Any opinions expressed herein are those of the author(s) and do not necessarily reflect those of Haag Technical Services, Haag Engineering Co., Haag Education, or parent company, Haag Global, Inc.

Ford is Recalling Certain 2015-2017 Ford Expedition and Lincoln Navigator Vehicles

NHTSA Campaign Number: 22V648000

Manufacturer Ford Motor Company

Components VISIBILITY, ELECTRICAL SYSTEM

Potential Number of Units Affected 198,482

Summary

Ford Motor Company (Ford) is recalling certain 2015-2017 Ford Expedition and Lincoln Navigator vehicles. The front blower motor located behind the glove box may fail.

Remedy

Dealers will replace the front blower motor assembly, free of charge. Owner notification letters are expected to be mailed September 12, 2022. Owners may contact Ford customer service at 1-866-436-7332. Ford’s number for this recall is 22S56.

Notes

Owners may also contact the National Highway Traffic Safety Administration Vehicle Safety Hotline at 1-888-327-4236 (TTY 1-800-424-9153), or go to www.nhtsa.gov.
Kia is Recalling Certain 2023 Sportage Vehicles

NHTSA Campaign Number: 22V651000

Manufacturer Kia America, Inc.

Components ELECTRICAL SYSTEM

Potential Number of Units Affected 19,701

Summary

Kia America, Inc. (Kia) is recalling certain 2023 Sportage vehicles. The alternator battery positive terminal nut may loosen, which can result in an engine stall or an electrical surge.

Remedy

Dealers will inspect and tighten the alternator battery positive terminal nut, as necessary, free of charge. Owner notification letters are expected to be mailed September 23, 2022. Owners may contact Kia customer service at 1-800-333-4542. Kia’s number for this recall is SC248.

Notes

Owners may also contact the National Highway Traffic Safety Administration Vehicle Safety Hotline at 1-888-327-4236 (TTY 1-800-424-9153), or go to www.nhtsa.gov.