Since 1963, Haag engineers have performed impact tests on and made field inspections of the myriad of roofing materials in order to determine their hail damage thresholds. Recent impact tests are performed in our Research/Testing facility with Haag’s IBL-7 and IBL-9 Ice Ball Launchers.
The Haag IBL-7 impacts roofing and other materials with simulated hailstones. Material samples are mounted onto test panels that mimic real-life support conditions. The sample is then targeted at specific locations for impacts. The IBL-7 can launch hailstones as small as one-half inch in diameter and as large as 2 ¼ inches in diameter at velocities that match real-world free-fall or wind-driven conditions. The IBL-9 launches hailstones ranging from 2-1/2″ to 4″. After the samples are impacted, they are examined for failure with a variety of techniques.
Haag Education creates many of its materials and resources, including Damage Assessment Field Guides, Haag Certified Inspector Courses, and Online seminars, with the testing and findings provided from the IAS accredited Haag Research/Testing department.
Visit our YouTube page to view more testing videos.
After strong windstorms, home and building owners may be concerned with the performance of their multi-pane windows. They question if and to what extent the windows have been affected by the storm. It’s a valid question: when can windstorms affect the performance of window?
To answer this question, we must first understand how multi-pane windows are built and what loads these windows typically sustain on a daily basis.
Simply put, multi-pane windows consist of a window frame that holds insulated glass (IG) units. IG units consist of two or more layers of glass with moisture-less gas trapped between them.
The trapped gas has an important purpose: it conducts heat less efficiently than outside air, lowering the heating and cooling demand on the building interior. This also has the added benefit that the windows are resistant to fogging and frosting.
On a daily basis, multi-pane windows are subjected to a range of weather conditions. In particular, let’s focus on the temperature changes. In the evening, the window components (including the gas between the panes of glass) lower in temperature. During the daytime, windows will increase in temperature, particularly those exposed to direct sunlight. Like any material, the trapped gas will expand when heated. This leads to a daily cycling of pressures within the IG unit. In the industry this phenomenon is referred to as solar or thermal pumping.
As might be assumed, thermal pumping takes a toll on the windows. Over time, as the seals deteriorate, thermal pumping stresses the seals between the glass. Eventually small fractures will develop and grow. These fractures allow increasing amounts of infiltration and exfiltration of air between the panes.
Manufacturers recognize and expect this to eventually occur. In addition to the seal, some manufacturers also add a desiccant between the glass panes. The desiccant will mitigate any moisture that finds its way in the IG unit. However, the desiccant is limited and eventually it will become saturated, allowing moisture to condense on the inside of the IG unit. This phenomena will eventually occur in any IG window, regardless of whether or not the window has been subjected to one or multiple strong storms.
Now, knowing how IG windows are built and the loads that these windows see on a daily basis, we again ask the question: can a strong windstorm affect the performance of a good or like-new window? If wind-borne debris compromises the glass or seal, the answer is yes. Evidence will be visible on the surface as cracked or fractured glass. Care should be taken to inspect portions of the window where the view of the glass may be obstructed by the window frame.
In the case of windows in poor condition, it is also possible that wind forces may be the “straw that breaks the camel’s back.” In this case, factors to consider are the directionality of the wind, the location of the windows on the building, debris impact marks or gouges, and the time elapsed since the storm. These items will help in the determination of whether or not wind was a contributing factor or if the window seals failed due to natural weathering.
Time since the storm and the extent of the fogging can provide good insight as to whether or not a storm was related. After a seal has failed, it takes time for moist air to enter the space between the glass panes. Further, the development of condensation is dependent on the presence of moist air. Once moist air has entered the space between panes, there is a progression of fogging. It begins as light translucent condensation, progresses as mist with water droplets, and finally becomes a thick opaque white haze as the water evaporates and condenses repeatedly, leaving the minerals in the water behind (see the figure below). Note that this process takes a long time. In the earliest stages, when the white haze has not yet formed, test methods for determining whether or not moisture has infiltrated should be considered.
The answer to whether or not wind can affect the performance of a window can be complicated and a proper inspection is essential. Further, the effect of wind forces needs to be considered in context with other factors, such as window maintenance, material properties, and possible issues in the original manufacturing. There are also methods for addressing the moisture once it does ingress, but their applicability and limitations should to be considered and addressed for each individual case.
By Carlos Lopez, PhD, PE, Haag Associate Engineer
Carlos graduated from the UN of FL with a BS, MS, and PhD in Civil Engineering. He is a member of the American Association for Wind Engineering, the American Society of Civil Engineering, and the American Concrete Institute. Carlos has assessed damage to hundreds of roofs since joining Haag in 2012. He also served as a key developer of the Haag Certified Inspector-Wind Damage Course. His primary areas of consulting are structural evaluations and general damage assessment. He also works in the Haag Research/Testing laboratory, designing new test apparatuses and performing experiments and industry-accepted testing procedures. For Carlos’ profile and contact information, click here.
by Richard F. Herzog P.E., Meteorologist, RRC, Haag Principal Engineer (posted 02/2016)
During the winter in much of the US, many of our roof problems and inspections revolve around ice dams. Severe ice dams can result in water intrusion, and falling ice from roofs and eaves can cause injury and property damage to buildings and vehicles. With the large snowstorm that affected in Mid-Atlantic and Northeast in late January 2016, ice dams are sure to develop to some buildings after freeze/thaw cycling. We want to help you prepare for these types of inspections by discussing the causes of ice dams, prevention of their formation, and snow/ice removal from roofs.
Causes and Prevention
The mechanism for formation of ice dams at roof eaves is well-understood, as are the proper construction techniques to minimize this condition. According to the Asphalt Roofing Manufacturers Association (ARMA), “Ice dams are typically formed by the continual thawing and freezing of melting snow or the backing up of frozen slush in gutters. When they occur, water can be forced under the roof and may cause damage to a home’s ceilings, walls, and insulation.”1 Note that the use of self-adhering membrane (commonly referred to as “ice and water shield”) at the eaves and valleys of a roof will not prevent an ice dam from forming, but will reduce the likelihood or severity of leakage because these membranes are more water-resistant at seams and fastener penetrations than standard underlayment.
Proper ventilation and insulation of the attic space is the best prevention technique to mitigate the formation of ice dams. The 2015 International Residential Code (IRC) in section R806.2 prescribes a minimum ratio of 1:150 of net free ventilation area to attic floor area for an unconditioned attic, and this figure has remained constant for many code cycles. An exception can reduce the ventilation amount to 1:300 in Climate Zones 6, 7, or 8 if two conditions are met: a vapor barrier on the warm side of the insulation (typically the top of the ceiling) and balanced ventilation between the eave region and the ridge region.2 (Please check the local building codes for the requirements in your area.) With certain weather conditions; however, some ice damming may occur even with code-compliant construction.
The difference that attic insulation and ventilation makes can be seen in the accompanying photographs that were taken at the same time in the same area. The house on the left (Figure 1) had proper insulation and ventilation, resulting in uniform coverage of snow across the roof and no ice damming. The townhouse on the right (Figure 2) had a poorly ventilated attic, causing the upper portion of the attic to warm and melt the snow near the ridge. The melted snow re-froze at the eave, causing an ice dam to form between the gables and large icicles at the eave.
Snow and Ice Removal
Once an ice dam has formed or water intrusion has been observed, the removal of the ice can be challenging and dangerous. We have performed many inspections where we have witnessed the damage done to shingles (Figure 3) and other building components from snow and ice removal. Sometimes property owners will use axes or other tools on the roof themselves, or search the web or phone book for “snow removal services” and hire that company to clear an ice dam without realizing that the primary snow removal service offered by the company is for driveways, sidewalks, and parking lots. If snow/ice removal is necessary, it would be recommended to use a licensed roofing contractor that offers “roof-specific” ice removal, as such individuals would have the proper safety equipment to access the roof and the proper tools to avoid damaging the roof. A common method for professional services is to use steam to quickly melt the ice. A steam machine does not spray large quantities of water or high-pressure water as would a “pressure-washer,” but the high temperature melts the ice. For shoveling or any mechanical removal of snow and ice, plastic tools would be preferred over metal to avoid damaging the roof covering, flashings, or siding. So, let it snow!
2International Code Council (2014), 2015 International Residential Code.
Richard F. Herzog P.E., Meteorologist, RRC, and Haag Principal Engineer (02/2016)
Richard Herzog’s primary areas of consulting are Roofing Systems, Building Envelope Systems, Evaluation of Wind Damage to Structures, Construction Defect Evaluations, Meteorological Investigations, Development of Hail Analysis Software, and Alternative Dispute Resolution. He serves as a primary advisor in the creation of many Haag Education seminars and products. See his profile here.
VALUABLE CLUES: WHAT TO LOOK FOR DURING COMMERCIAL ROOF INSPECTIONS
by Ken Gilvary, M.S., P.E., Haag Principal Engineer, 01/2016
Commercial roofing is one of the most demanding areas for expertise in the insurance industry today, as there are millions of commercial structures and hundreds of different roofing systems and variations in application. Further, the history of a building’s roof may have a significant influence on its performance. There may be multiple layers of roofing on a single building which include different materials and installation. Turning back the layers of roofing can reveal historic clues to help us in our evaluations, similar to turning the pages of a good mystery novel. Use the following tips to aid you in resolving roofing mysteries and reaching accurate conclusions.
The three most common types of low-slope commercial roofing systems are built-up roofing, modified bitumen roofing, and single-ply roofing. Built-up roofing comprises multiple layers of felt sandwiched together with molten asphalt, which are typically covered with a protective coating, gravel ballast, or a roll-roofing cap-sheet. These built-up systems offer redundancy due to their multiple layers of reinforcements. Modified bitumen roofing systems normally comprise a felt base sheet covered with one or two plies of modified bitumen membrane. The modified bitumen membrane comprises reinforcement coated with asphalt and mixed with a plastic or rubber to make the bitumen substantially tougher and resistant to tearing. The modified bitumen also needs to be covered with a protective coating such as aluminum-rich paint or granules to protect it from sun exposure. Single-ply roof systems comprise a variety of plastics and rubbers, including ethylene propylene diene monomer (EPDM), thermoplastic olefin/polyolefin (TPO), and polyvinyl chloride (PVC). These systems are single-layer applications of roofing sheets that are bonded along their seams with heat or adhesive. They rely directly on the strength of these seam bonds to keep water from infiltrating the building. Single-ply systems are designed for direct exposure to sunlight. When evaluating a roof system, it is important to determine the constituents and attachment of the system, as this information can provide clues as to how the roofing will respond to storm events such as wind and/or hail.
With respect to hail, we should consider that hail storms typically have a predominant fall direction. This direction can be determined by the examination of building features both on and off the roof. Hailstone impacts can leave distinct spatter marks on oxidized surfaces such as electric junction boxes, and they often leave permanent evidence of impacts as dents in metals (such as air-conditioner cooling fins, roof vents, and flashing). Roofing surfaces exposed to the predominant direction of hail-fall will experience the most severe impact, and these areas should be the first to exhibit damage, if any occurs. Likewise, if damage occurs, it is expected to be more frequent and more severe on surfaces facing the predominant hail-fall direction.
It should also be noted that roofing systems installed over softer substrates (such as foam insulation boards) are more susceptible to hail strikes than those installed over stiffer substrates (such as plywood, concrete, or gypsum cover boards). This is due to the deflection that can occur in these substances. Further, areas of ponded water can accelerate the deterioration of roofing membranes and can make these areas more susceptible to impact.
Evaluation of large hail strikes against built-up and modified bitumen roof systems often requires the removal of roofing cores, which are transported to the lab for further examination. Removal of roofing cores also permits an opportunity to determine the roof system cross-section, the membrane thickness, and to check for moisture below the roof membrane. In these instances, we regularly examine the sample under magnification, and then remove the bitumen from the core with solvent to examine the reinforcing for strain and tears characteristic of impacts. Once the roofing has been cut, you can use a tool like the Haag Panel and Membrane Gauge™ to measure and document the thickness of the membrane for your file Hail damage to single-ply roofing systems typically is discernible in the field; however, it may be helpful to remove cores from the roofing and examine areas of interest with a microscope and/or high intensity backlighting to identify fractures caused by hailstone impacts (particularly with TPO products).
With respect to windstorm evaluations, we need to recognize that a building has widely varying force levels on its roof surfaces. It is reasonable to expect the most severe wind damage to occur at the windward corners and edges of the roof where wind forces are the strongest. It is for this reason that building codes require more uplift resistance capacity for roofing in these areas. In fact, it is not uncommon for roof fastener patterns on shoreline structures and tall buildings to
require 50 percent more fasteners along the edges and 100 percent more fasteners in roofing corners than in the field of the roof. If wind forces have reached levels strong enough to damage the common commercial roofing systems, there typically is some combination of lifted, torn, and/or peeled roofing concentrated where wind forces are the strongest (ie. at the windward edges and corners of the roof). Additionally, we should examine the roof system at roof penetrations to look for wrinkles and tears or any other evidence of membrane displacement. If we find that roofing failure has occurred at wind speeds less than expected, we should examine and document the roof system attachment within those areas. Often premature failure occurs due to inadequate fasteners, inadequate adhesion, or some combination of the two. Situations such as these may be significant subrogation opportunities. In these instances, it is particularly important to turn back all of the roofing layers to properly evaluate the roof and support your conclusions. The layers of roofing, their attachments, and their performance tell the story; all we have to do is know how to read it.
Kenneth R. Gilvary is a licensed Professional Engineer in 16 states. He was employed by Haag Engineering Co. from 2003-2017. He has extensive experience with design, construction administration, and evaluation of large-scale projects involving multiple buildings. He currently sits on the Board of Directors of the Windstorm Insurance Network (WIND), Inc., and the Property Loss Research Bureau (PLRB) planning committee. He is a member of the ASTM E-06 Performance of Buildings Committee and is a developer. He was an instructor for the Haag Certified Inspector (HCI) programs. Ken also is an All-Lines Insurance General Adjuster licensed in Florida with experience in adjusting large commercial losses.
By Tim Marshall, P.E., Meteorologist, Haag Principal Engineer
Have you ever wondered whether National Weather Service (NWS) radars can tell if it hailed on a particular roof? There is a high probability it can! Radar information is available online from the National Climatic Data Center at: https://www.ncdc.noaa.gov/data-access/radar-data as well as other sources. Haag engineers and meteorologists routinely study radar images or analyses to determine the likelihood that hail fell at a specific location. Such information can help our clients better understand hail history. Radar studies have shown good correlation in determining hail aloft and whether it reaches the ground. However, there are too many uncertainties with weather radar to accurately tell maximum hail size at a particular location. While some organizations provide such algorithm output, this type of data must be reviewed with caution and correlated with all other available evidence. Haag engineers and meteorologists conduct site specific inspections to verify if it hailed and determine the size, hardness, and direction of hail fall. We look for the presence of scuff marks on wood surfaces and spatter marks on metal and other surfaces that have oxidation, grime, and organic growths. Such marks are usually visible within a year or two after the hail event. Radar output does not take the place of detailed site specific inspections.
The following is a short treatise on radar to better explain what it can and cannot do. Radar is an acronym that stands for Radio Detection and Ranging. It was developed during WWII to track aircraft and missiles. Advancements in technology have greatly improved radar quality and resolution over the years. Today, there are more than 150 weather radars operated by the National Weather Service throughout the U.S.
These radars emit extremely short bursts of radio waves, called pulses. Each pulse of energy lasts about 0.00000157 seconds (1.57×10⁻⁶), with a 0.00099843-second (998.43×10⁻⁶) “listening period” in between.
The transmitted radio waves move through the atmosphere at about the speed of light. By knowing the direction the antenna is pointed, and timing of returned energy, the location of the target can be determined. Generally, the better the target is at reflecting radio waves (i.e., more raindrops, larger hailstones, etc.), the stronger the reflected radio waves, or echo, will be. This is because the energy reflected is proportional to the target diameters to the sixth power. The radar antenna is 28 feet wide and contained within a fiberglass radome to protect it from the weather. The antenna is mounted on a tower to limit interference of near ground obstructions (Figure 2). Every five minutes or so, the radar conducts a volume scan, rotating up to 19.5 degrees above the horizon, and providing a “snapshot” of echo intensity and location. Radar cannot see above 19.5 degrees which might not even see a storm very close to the radar site. The area not sampled above the radar is called the “cone of silence” (Figure 3). Also, radar does not sample below 0.5 degrees to minimize ground interference and radiating people.
The radar antenna samples the returned energy at some height above the ground. Also, radar resolution decreases with increasing distance as the radar beam widens and rises above the ground; the latter occurs due to the curvature of the earth. Just because radar might detect hail aloft, does not necessarily mean it will fall directly below at the ground. This is because winds aloft can blow hailstones downstream. Also, hail melts as it falls into increasingly warmer air. So, the depth of the warm air is important.
Received radar energy goes through electronic processing where computer algorithms dissect the data so that it can be displayed. Three-dimensional information is placed into color-coded bins on a two-dimensional map of the area. Figure 4 shows a display of radar reflectivity. Green colors indicate light precipitation, yellow moderate precipitation, and red intense precipitation. Darker red and purple colors indicate a high probability of hail at that altitude. Sometimes, a false echo or spike is found emanating from a radar echo which also indicates the presence of hail. Super Resolution data provides base radar reflectivity at 0.5 degree azimuth by 250 m range gate, which is much larger than a building roof. Figure 5 shows a close-up view of base reflectivity showing the size of a radar bin that was 15 miles from the radar. The size of the radar bin was much larger than that of a house. Thus, radar cannot sense hail at a point.
In the past few years, NWS radars have upgraded to dual polarization (Dual-Pol) technology. Such radars send out horizontal and vertical pulses of energies which provide more information about precipitation type. Rain typically falls like flat plates (not the typical drop shape that kids draw) while hail is generally rounded (roughly spherical). Thus dual-pol radars can better distinguish rain from hail, but the resolution is still not fine enough to distinguish the sizes of individual hailstones . This improvement still has the same limitations as single-wave radars. Despite these limitations, weather radar is a valuable tool used in the prediction of hail. But, a prediction is not a verified result. Radar cannot tell the specific size(s), quantity, direction(s), or hardness, of hailstones at a particular address, or whether the hail actually caused any damage to roofing or other exterior building components. Verification requires ground truth and Haag experts routinely perform such site specific inspections. Since the purpose of site inspections is to determine the extent and severity of damage to building materials, and not simply to determine the whether hail fell or the size of hail, radar data will not replace the need to have well-trained inspectors make evaluations.
Fig. 1
National Doppler Radar Site locations. (Sept. 8, 2015). [Map illustration of the NWS Radar Sites]. National Doppler Radar Sites. Retrieved from http://radar.weather.gov/.
Hail Storm, Memphis, TN, 02/06/2008. (Sept. 8, 2015). [Doppler Radar image showing a storm moving over Memphis on 02/06/2008.] Available online at http://www.roc.noaa.gov/WSR88D/About.aspx .
Fig. 5
NEXRAD Image, Dallas, TX, 05/25/2011. (Nov. 2, 2015). [Doppler Radar image showing a house point on radar.] Available online at http://www.roc.noaa.gov/WSR88D/About.aspx .
Tim Marshall is a structural engineer and meteorologist. He has served as a Haag Engineer since 1983, assessing damage to 1000s of structures (particularly damage caused by wind and other weather phenomena). He has written numerous articles, presented countless lectures, and appeared on dozens of television programs in order to share his extensive knowledge re: storms and the resultant damage. He is a primary author of many Haag Education materials, including the Haag Certified Inspector-Wind Damage course. He is also a pioneering storm chaser and was editor of Storm Track magazine.
___
Any opinions expressed herein are those of the author(s) and do not necessarily reflect those of Haag Technical Services, Haag Engineering Co., Haag Education, or parent company, Haag Global, Inc.
Have you ever wondered whether National Weather Service (NWS) radars can tell if it hailed on a particular roof? There is a high probability it can! Radar information is available online from the National Climatic Data Center at: https://www.ncdc.noaa.gov/data-access/radar-data as well as other sources. Haag engineers and meteorologists routinely study radar images or analyses to determine the likelihood that hail fell at a specific location. Such information can help our clients better understand hail history. Radar studies have shown good correlation in determining hail aloft and whether it reaches the ground. However, there are too many uncertainties with weather radar to accurately tell maximum hail size at a particular location. While some organizations provide such algorithm output, this type of data must be reviewed with caution and correlated with all other available evidence. Haag engineers and meteorologists conduct site specific inspections to verify if it hailed and determine the size, hardness, and direction of hail fall. We look for the presence of scuff marks on wood surfaces and spatter marks on metal and other surfaces that have oxidation, grime, and organic growths. Such marks are usually visible within a year or two after the hail event. Radar output does not take the place of detailed site specific inspections.
The following is a short treatise on radar to better explain what it can and cannot do. Radar is an acronym that stands for Radio Detection and Ranging. It was developed during WWII to track aircraft and missiles. Advancements in technology have greatly improved radar quality and resolution over the years. Today, there are more than 150 weather radars operated by the National Weather Service throughout the U.S. (Figure 1).
These radars emit extremely short bursts of radio waves, called pulses. Each pulse of energy lasts about 0.00000157 seconds (1.57×10⁻⁶), with a 0.00099843-second (998.43×10⁻⁶) “listening period” in between.
The transmitted radio waves move through the atmosphere at about the speed of light. By knowing the direction the antenna is pointed, and timing of returned energy, the location of the target can be determined. Generally, the better the target is at reflecting radio waves (i.e., more raindrops, larger hailstones, etc.), the stronger the reflected radio waves, or echo, will be. This is because the energy reflected is proportional to the target number and target diameter to the sixth power. The radar antenna is 28 feet in diameter and contained within a fiberglass radome to protect it from the weather. The antenna is mounted on a tower to limit interference of near ground obstructions (Figure 2). Every five minutes or so, the radar completes a volume scan, rotating up to 19.5 degrees above the horizon, and providing a “snapshot” of echo intensity and location. Radar cannot see above 19.5 degrees which might not even see a storm very close to the radar site. The area not sampled above the radar is called the “cone of silence” (Figure 3). Also, radar does not sample below 0.5 degrees to minimize ground interference.
The radar antenna samples the returned energy at some height above the ground. Also, radar resolution decreases with increasing distance as the radar beam widens and rises above the ground; the latter occurs due to the curvature of the earth. Just because radar might detect hail aloft, does not necessarily mean it will fall directly below at the ground. This is because winds aloft can blow hailstones downstream. Also, hail melts as it falls into increasingly warmer air. So, the depth of the warm air is important.
Received radar energy goes through electronic processing where computer algorithms dissect the data so that it can be displayed. Three-dimensional information is placed into color-coded bins on a two-dimensional map of the area. Figure 4 shows a display of radar reflectivity. Green colors indicate light precipitation, yellow moderate precipitation, and red intense precipitation. Darker red and purple colors indicate a high probability of hail at that altitude. Sometimes, a false echo or spike is found emanating from a radar echo which also indicates the presence of hail. Figure 5 shows a close-up view of base reflectivity showing the size of a radar bin that was 15 miles from the radar. The size of the radar bin was much larger than that of a house. Thus, radar cannot sense hail at a point.
In the past few years, NWS radars have upgraded to dual polarization (Dual-Pol) technology. Such radars send out horizontal and vertical pulses of energies which provide more information about precipitation type. Rain typically falls like elliptical plates (not the typical drop or round shape that kids draw) while hail is generally rounded (roughly spherical). Thus dual-pol radars can better distinguish rain from hail, but the resolution is still not fine enough to distinguish the sizes of individual hailstones . This improvement still has the same limitations as single-wave radars. Despite these limitations, weather radar is a valuable tool used in the prediction of hail. But, a prediction is not a verified result. Radar cannot tell the specific size(s), quantity, direction(s), or hardness, of hailstones at a particular address, or whether the hail actually caused any damage to roofing or other exterior building components. Verification requires ground truth and Haag experts routinely perform such site specific inspections. Since the purpose of site inspections is to determine the extent and severity of damage to building materials, and not simply to determine the whether hail fell or the size of hail, radar data will not replace the need to have well-trained inspectors make evaluations.
Fig. 1
National Doppler Radar Site locations [Map illustration of the NWS Radar Sites]. National Doppler Radar Sites. Retrieved from http://radar.weather.gov/.
By Tim Marshall, P.E., Meteorologist, Haag Principal Engineer
Tim Marshall is a structural engineer and meteorologist. He has served as a Haag Engineer since 1983, assessing damage to 1000s of structures (particularly damage caused by wind and other weather phenomena). He has written numerous articles, presented countless lectures, and appeared on dozens of television programs in order to share his extensive knowledge re: storms and the resultant damage. He is a primary author of many Haag Education materials, including the Haag Certified Inspector-Wind Damage course. He is also a pioneering storm chaser and was editor of Storm Track magazine. See his profile here.
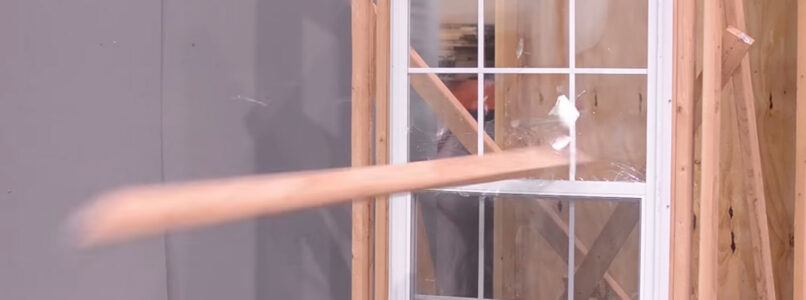
Haag’s Research & Testing laboratory, which plays a crucial role in the development of Haag courses and publications, has earned its accreditation from the International Accreditation Service (IAS) for product testing! Watch this video blog post for a behind-the-scenes look into the exciting tests performed in the lab (including impact testing with 2x4s and 4″ ice balls!).
If “a picture is worth 1,000 words,” how valuable is the capability to place yourself within an image and pan around? Or even zoom in?
I call it the “Google Street View effect”: the desire of tech-savvy users to control their own movements within images and videos that have been taken elsewhere, by someone else. Though Google’s Street View service is perhaps the most well-known use of this type of technology and has been available for almost eight years, panoramic virtual tours have been utilized in the real estate industry for nearly twice as long. Now a new wave of users in the damage assessment industry are finding that virtual tours can be extremely useful during inspection and construction. Utilizing specialized cameras, lenses and software, photographers can create 360° spherical imagery of a specific location, allowing other viewers to become virtual on-site witnesses.
What Type of Equipment is Needed?
Haag has used spherical photography and virtual tours for over three years on a variety of projects, including damage assessments, incident documentation, construction monitoring, and historical documentation and recordation, just to name a few. The process involves image acquisition, photo stitching/merging, and tour creation. Hardware includes a standard DSLR camera and photographic tripod, a fisheye lens, and spherical camera mount.
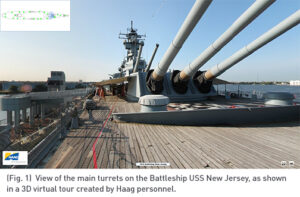
The camera tripod is set and a series of photographs are taken (typically 6) utilizing the camera mount. The spherical camera mount has settings that ensures that there is a 360° horizontal coverage, creating the spherical image. (Some specially-designed cameras can even take a 360° image without any manual effort.) The camera system is then moved to the next desired location and the process repeated until all desired locations are documented. Typical setup locations include any key Points of View (or POV, see Fig. 1), witness locations, areas where damage is present, and areas that show inconsistencies in construction or manufacture (or anything out of the ordinary for a scene).
Later, back in the office, users stitch the six individual images together, creating a final spherical image for every noted setup location. Tours can then be created utilizing specialized software which combines the multiple spherical images into a single file. This file can be linked to a map with a “radar” showing the POV of the camera, along with links to all the photographs, videos and PDFs used within each spherical image. (The map is typically created to allow the tour users to have a point of reference in the context of the whole scene.)
The end product can be delivered as a self-executable file (EXE), or it may be loaded onto a website or mobile device, among other formats. Key information can be placed within the virtual tour, including still photographs, field notes, videos, links to OSHA standards or websites, or other applicable documentation. The resulting product allows persons never on a site to “be there” with the photographer. They can see “first-hand” notable conditions and, crucially, view a photograph within the surrounding context while controlling their movements in the virtual space.
See a 3D Tour in Action
Check out an example of a virtual tour here. In this short video of a 3D Tour created by Haag personnel, you’ll be able to see how easily a viewer can maneuver through a Virtual Tour of the Battleship USS New Jersey.
Kevin Kianka, P.E., Director of Haag BIM/Modeling Program, 07/2015
Kevin Kianka, P.E., serves as the Director of BIM/Modeling Program for Haag Technical Services, overseeing the office production of deliverables for clients, in addition to serving as a Project Manager on multiple projects. He recently spearheaded the effort to petition for and obtain Haag’s FAA Section 333 Exemption. See his profile and contact information here.


 By Carlos Lopez, PhD, PE, Haag Associate Engineer
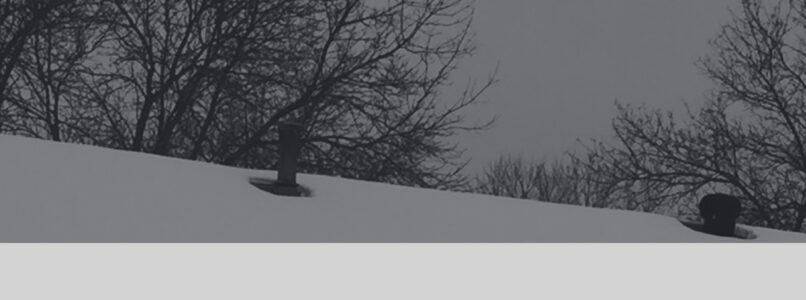


 Kevin Kianka, P.E., Director of Haag BIM/Modeling Program, 07/2015